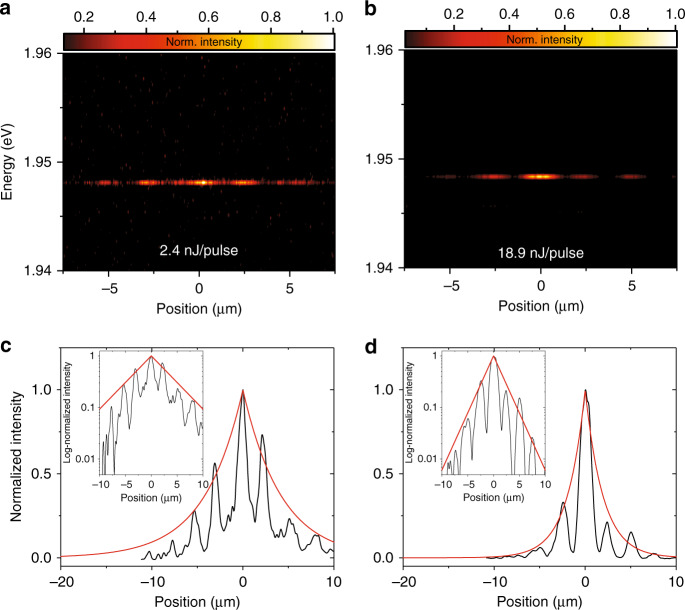
Fig. 4. Self-localization of a gap-solitonic mode.
a, b Energy-resolved real-space images under on-site pumping conditions little above threshold (a P = 2.4 nJ/pulse) and far above threshold (b P = 18.9 nJ/pulse). c, d The intensity traces (black) are fitted by an exponential function (red). Narrowing of the spatial extension of the condensate from 7.0 ± 0.8 μm slightly above threshold to 3.6 ± 0.5 μm at approximately one order of magnitude above threshold characterizes the gap state. In the insets, the same profiles are shown in log scale.

