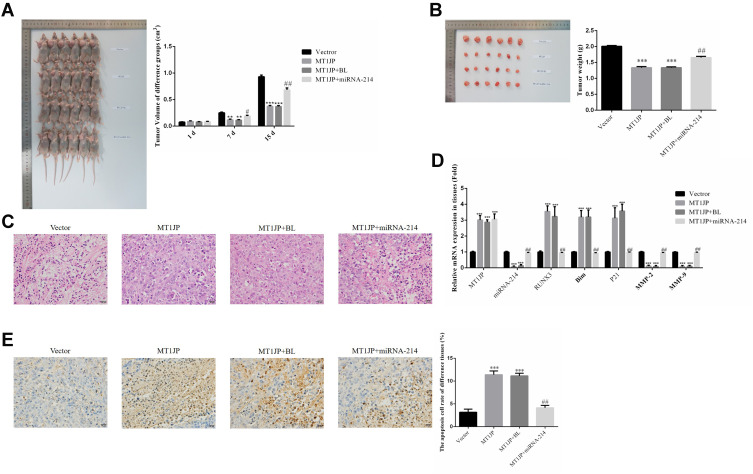
Figure 7.
Effect of MT1JP on breast cancer cells in vivo. (A) Tumor volume of different experimental groups at different time points. **P<0.01, ***P<0.001, compared with Vector group; #P<0.05, ##P<0.01, compared with MT1JP group. (B) Tumor weight of different experimental groups ***P<0.001, compared with the Vector group; ##P<0.01, compared with the MT1JP group. (C) Pathology of different experimental groups by HE staining (×400 magnification). (D) Relative gene expression in different experimental groups by RT-qPCR assay. ***P<0.001, compared with the Vector group; ##P<0.01, compared with the MT1JP group. (E) Apoptotic cell number of different tissues by TUNEL assay (×400 magnification) ***P<0.001, compared with the Vector group; ##P<0.01, compared with the MT1JP group.

