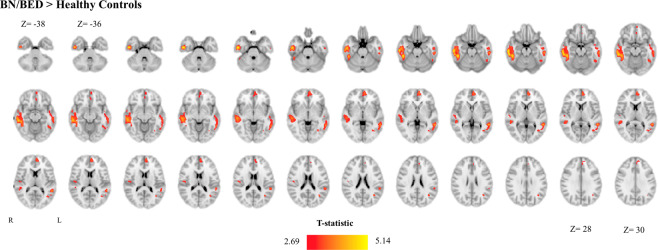
Fig. 2. Increases in resting regional cerebral blood flow (rCBF) in the brain of BN/BED patients (whole-brain analysis).
This figure shows the results of a directed T-contrast analysis at the whole-brain level where we tested for increases (BN/BED > Controls) or decreases (Controls > BN/BED) in rCBF in patients compared with controls, accounting for global grey-matter cerebral blood flow and BMI. Whole-brain cluster-level inference was applied at α = 0.05 using family-wise error (FWE) correction for multiple comparisons and a cluster-forming threshold of p = 0.005 (uncorrected). Images are shown as T-statistic in radiological convention. We did not find any significant cluster BN/BED patients presented lower rCBF than healthy controls.

