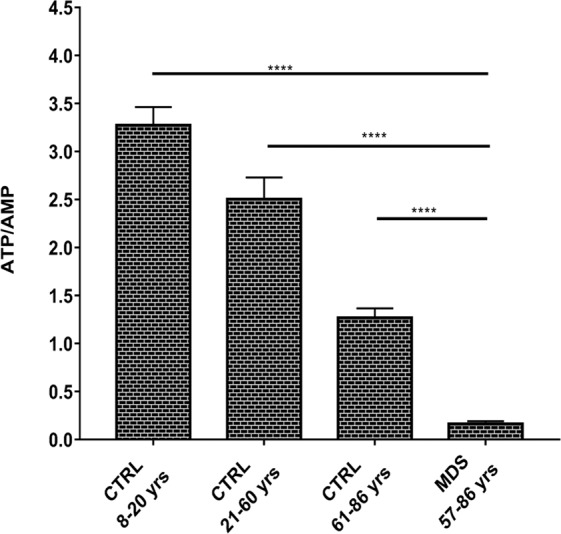
Figure 1.

ATP/AMP ratio. ATP/AMP ratio in MNCs isolated from young healthy subjects (CTRL 8–20 yrs), adult healthy subjects (CTRL 21–60 yrs), elderly healthy subjects (CTRL 61–86 yrs) and MDS patients with iron overload. Each column represents the mean ± SEM. Data are analyzed by one-way ANOVA followed by Tukey’s multiple comparison test. **** indicates a significant difference for p < 0.0001 between MDS sample and the healthy controls.
