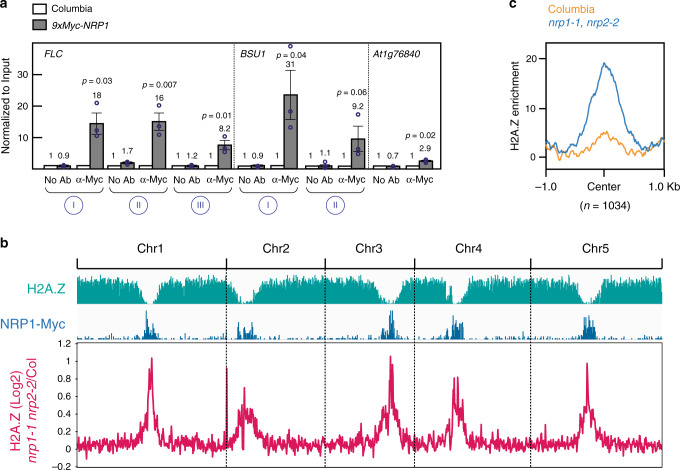
Fig. 4. Genome-wide localization of NRP1.
a Quantification of 9xMyc-NRP1 binding to FLC and BSU1 occupancy levels in Columbia (WT) and nrp1-1 nrp2-2 double mutant. Error bars represent standard error from three biological replicates. Two-tailed, paired Student’s t test was used to determine p-value. At1g76840, which has almost no reads in ChIP-Seq analysis, is shown as a control. b Genome-wide distribution of H2A.Z in wild-type (turquoise) and NRP1-9xMyc in wild-type (blue). In both cases, peaks were defined using Narrow Peaks. The magenta line represents differential H2A.Z occupancy between nrp1-1 nrp2-2 and Columbia. c H2A.Z occupancy levels in Columbia (WT) and nrp1-1 nrp2-2 double mutant background plotted over highly significant, likelihood ratio>1000, NRP1-9xmyc ChIP-Seq peaks. Source data underlying Fig. 4a, b are provided as a Source Data file.

