Figure 4.

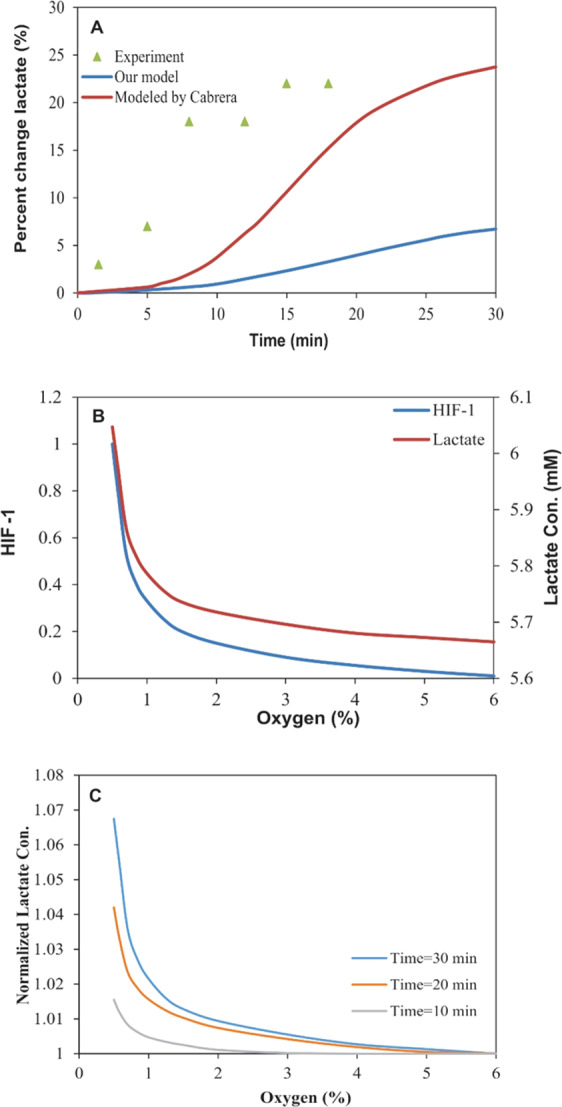
Changes in the intracellular lactate levels during severe hypoxia. (A) The intracellular lactate level changes during severe hypoxia in the proposed model, experimental data and Cabrera model. (B) The changes in HIF-1 (studied by Qutub) and the lactate concentration vs. oxygen levels after 30 min of hypoxia exposure in the proposed model. (C) The normalized lactate concentrations after different periods of hypoxia exposure.
