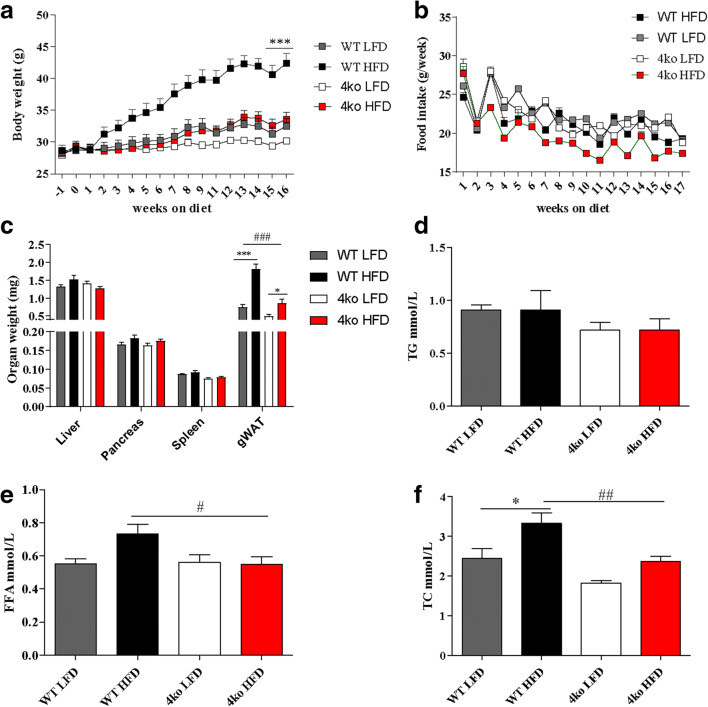
Fig. 2.
Phenotype at the end of the diet. WT, wild-type mice; 4ko, Casp1/Casp11/NE/PR3 knockout mice. a Gain in body weight during the HFD/LFD intervention. b Weekly food intake for the four groups of mice. c Liver, pancreas, spleen, and gWAT weight at the end of diet intervention. d Plasma concentrations of triglycerides (TG) at the end of diet intervention. e Plasma concentrations of free fatty acids at the end of diet intervention. f Plasma concentrations of total cholesterol (TC) at the end of diet intervention. All samples were measured in a single replicate. Data is represented as mean ± SEM. *p < 0.05, effect of the diet; ***p < 0.001, effect of the diet; #p < 0.05, effect of the genotype; ##p < 0.01, effect of the genotype; ###p < 0.001, effect of the genotype.

