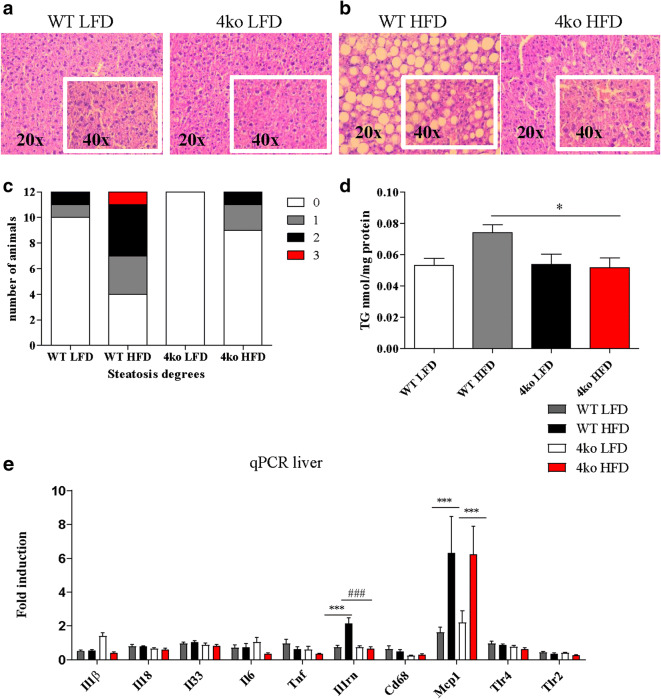
Fig. 3.
Liver status at the end of the diet. WT, wild-type mice; 4ko, Casp1/Casp11/NE/PR3 knockout mice. a Representative images of liver histology in the groups that received LFD at × 20 magnification, respectively × 40 magnification. b Representative image of liver histology in the groups that received HFD at × 20 magnification, respectively × 40 magnification. c Number of animals affected by different degrees of liver steatosis. d Triglyceride content of the liver in the four groups of mice. All samples were measured in a single replicate. e mRNA fold induction of several genes in the liver in the four groups of mice. All samples were measured in duplicates. Data is represented as mean ± SEM. *p < 0.05, effect of the diet; ***p < 0.001, effect of the diet; #p < 0.05, effect of the genotype; ###p < 0.001, effect of the genotype.

