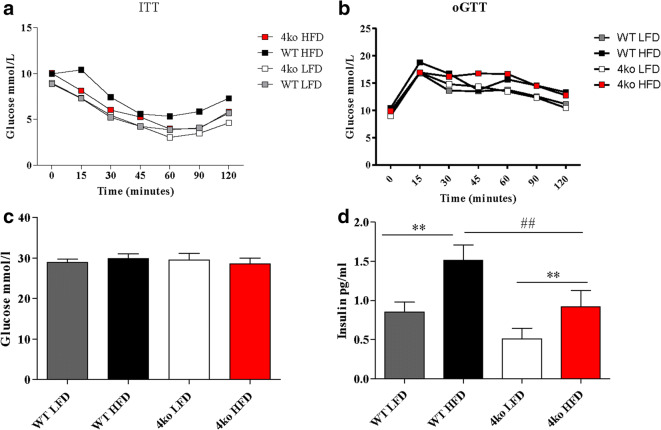
Fig. 5.
Glucose homeostasis. WT, wild-type mice; 4ko, Casp1/Casp11/NE/PR3 knockout mice. a Glucose blood levels during the insulin tolerance test (ITT). b Glucose blood levels during an oral glucose tolerance test. c Glucose concentration in plasma at the end of the diet intervention. d Insulin concentration in plasma at the end of the diet intervention. All samples were measured in a single replicate. Data is represented as mean ± SEM. **p < 0.01, effect of the diet; ##p < 0.01, effect of the genotype.

