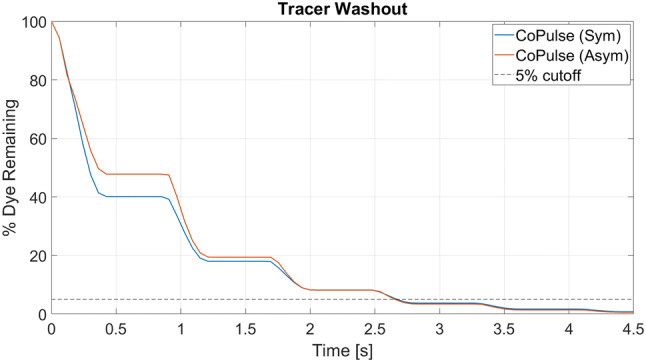
Figure 5.

Time evolution for dye washout in the symmetric and the asymmetric design of the CoPulse pump. The virtual dye injection experiment started with the systolic phase (t = 0–0.4 s) where some of the tracer was expelled together with blood, causing a drop in the dye concentration. In the subsequent filling phase (t = 0.4–0.8 s), pure blood entered the pump while the tracer concentration within the chamber remained constant. This cycle recurred throughout the entire pumping process, eventually resulting in a staggered progression of dye washout.
