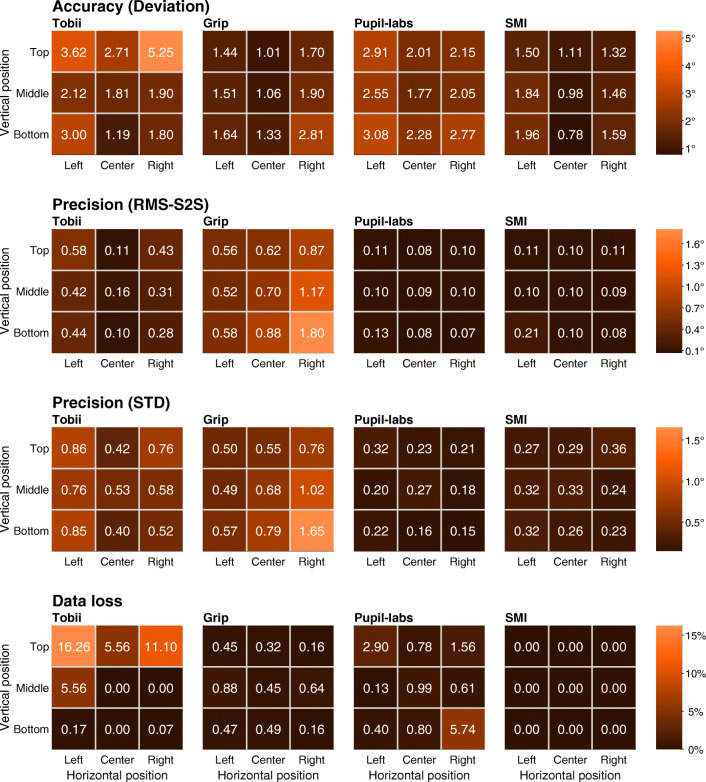
Fig. 6.
Data quality measures as a function of gaze target location. Heatmaps showing deviation (first row), RMS-S2S (second row), STD (third row), and data loss (fourth row) as a function of gaze target location for each of the head-worn eye-tracking setups (Tobii: Tobii Glasses 2 + firmware version 1.25.3-citronkola; Grip: Pupil headset + EyeRecToo (Grip/PuReST); Pupil-labs: Pupil headset + Pupil Capture; and SMI: SMI ETG2 + iViewETG), for the first validation moment at the start of a recording. In each panel, every square represents a gaze target location and the color of the square corresponds to the value determined for the given measure at that gaze target location (e.g., the top-left square in each panel indicates the data quality for the top-left gaze target). The non-central gaze targets were at horizontal eccentricities of 17∘ and vertical eccentricities of 11∘. Coloring of the squares is according to the color bar legend shown on the right of each row

