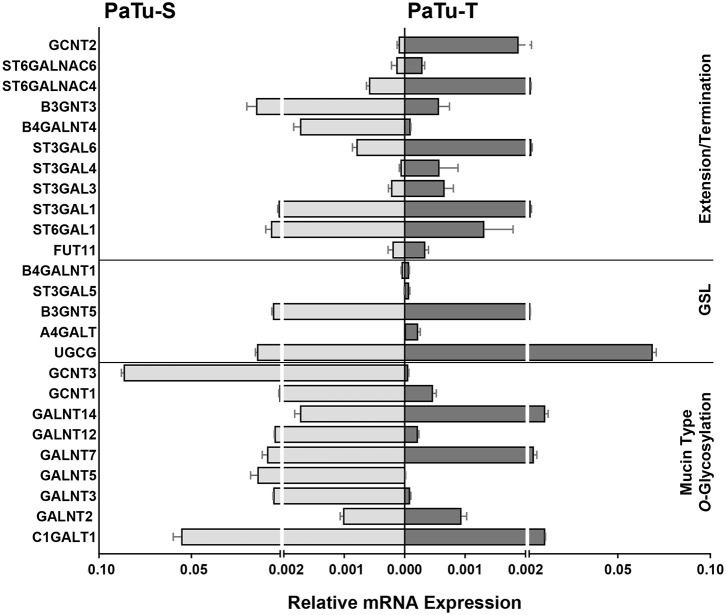
Figure 2.
mRNA levels of selected GT genes in PaTu-S and PaTu-T. Validation by qRT-PCR of the expression of selected GT genes involved in O-glycan core and glycosphingolipid synthesis as well as in extension or termination of various glycan structures in PaTu-S (light gray bars) vs. PaTu-T cells (dark gray bars). mRNA levels are shown as relative abundance to the household reference gene GAPDH ± SEM of at least 3 independent experiments.

