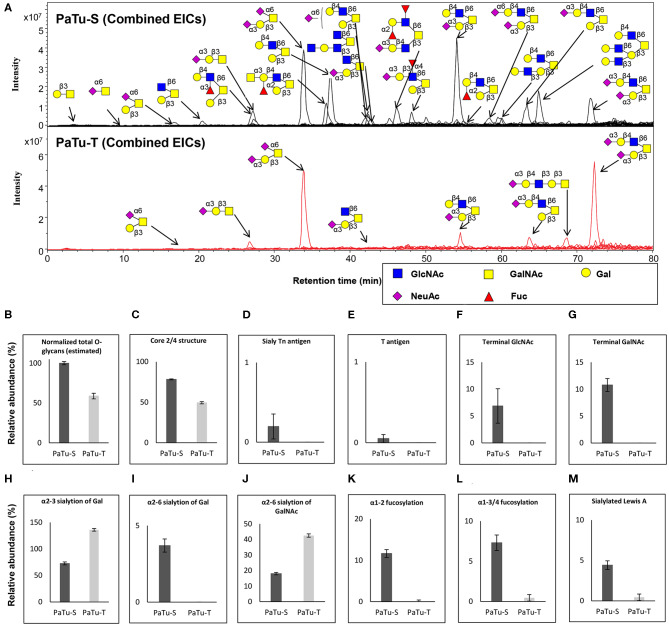
Figure 4.
O-glycosylation analysis in PaTu-S and PaTu-T by PGC nano-LC-ESI-MS/MS. (A) Combined extracted ion chromatograms (EICs) of O-glycans derived from PaTu-S and PaTu-T cell lines. (B–M) Relative abundance of structural O-glycan classes derived from 0.5 million PaTu-S and PaTu-T cells on PGC nano-LC-ESI-MS/MS in negative ion mode (displayed as mean relative abundance plus standard deviation; N = 3). (B) Normalized total O-glycan content (estimated), (C) Core2/4 O-glycan structure, (D) Sialylated Tn antigen, (E) T antigen, (F) Terminal GlcNAc, (G) Terminal GalNAc, (H) α2,3-sialylation of Gal, (I) α2,6-sialylation of Gal, (J) α2,6-sialylation of GalNAc, (K) α1,2-fucosylation, (L) α1,3/4-fucosylation, and (M) sLeA.

