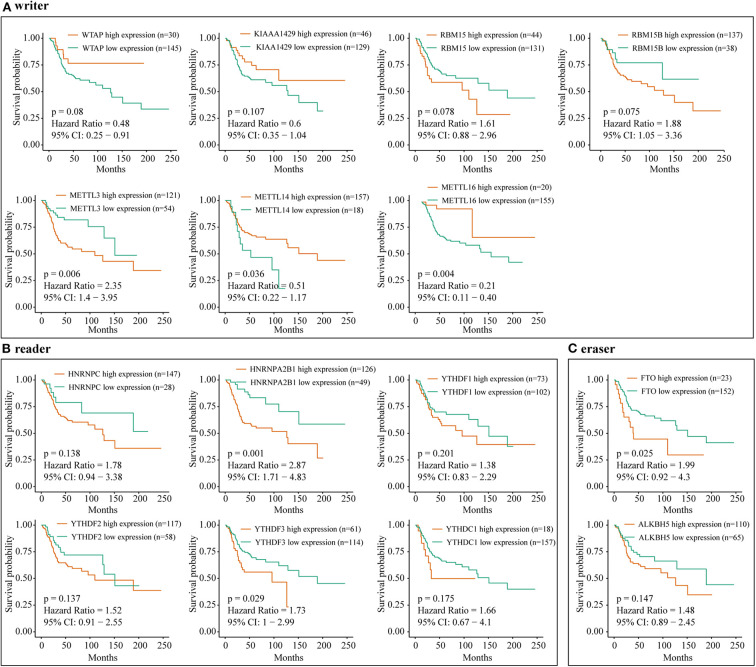
Figure 5.
The correlation between m6A-related regulator expression and overall survival of osteosarcoma patients in the meta-cohort. (A) Kaplan–Meier analysis showing the correlation between m6A “writers” expression levels and the OS patients' survival rates. (B) Kaplan–Meier analysis showing the correlation between m6A “readers” expression levels and the OS patients' survival rates. (C) Kaplan–Meier analysis showing the correlation between m6A “erasers” expression levels and the OS patients' survival rates.

