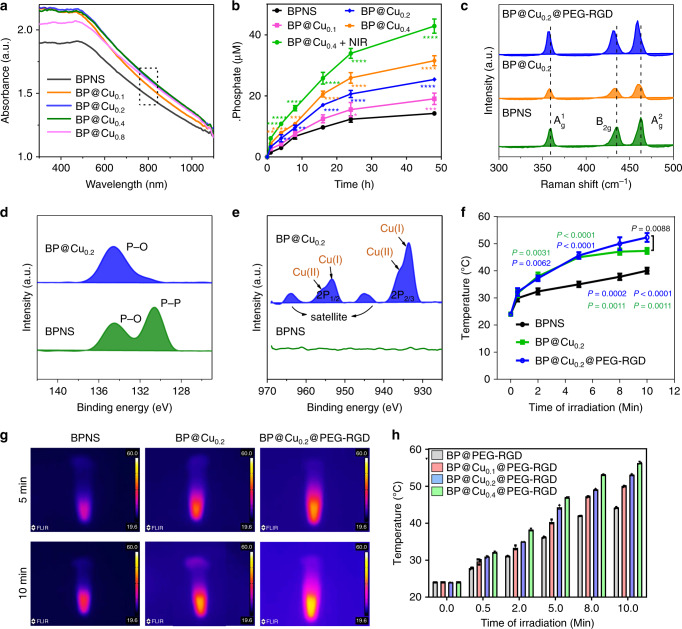
Fig. 3. Influence of Cu2+ ions on the stability and photothermal effects of BPNS.
a UV–vis absorbance spectra of BPNS, BP@Cu0.1, and BP@Cu0.2 and BP@Cu0.4 with the same amount of BPNS (100 ppm). b Measurement of phosphate anions by phosphate assay kit. Degradation of BPNSs and BP@Cux with the same amounts of BPNS (50 ppm) after storage in water for different periods, producing increasing concentrations of phosphate anions in the supernatant. The data show mean ± s.d. n = 3. *P < 0.05, **P < 0.01, ***P < 0.001, ****P < 0.0001, analyzed by one-way ANOVA, followed by Tukey’s multiple comparisons post-test. c Raman scattering spectra of BPNS, BP@Cu0.2, and BP@Cu0.2@PEG-RGD. d High-resolution XPS spectra showing the binding energies of P2p of BPNS and BP@Cu0.2. e High-resolution XPS spectra showing the binding energy of Cu2P of BPNS and BP@Cu0.2. f Photothermal heating curves recording the temperature variations of BPNS, BP@Cu0.2, and BP@Cu0.2@PEG-RGD with the same amount of BPNS (20 ppm) dispersed in PBS. The data show mean ± s.d., n = 3. P values marked in green and blue colors indicate statistically significant differences compared with the BPNS group. P values marked in black value indicates statistically significant differences between BP@Cu0.2 and BP@Cu0.2@PEG-RGD. Analyzed by one-way ANOVA, followed by Tukey’s multiple comparisons post-test. g Infrared thermographic maps of BPNS, BP@Cu0.2, and BP@Cu0.2@PEG-RGD with the same amounts of BPNS (20 ppm) in tubes after irradiation for 5 and 10 min under the 808 nm laser (1 W cm−2). h The temperature increments of different BP@Cux@PEG-RGD samples under NIR laser irradiation by an 808 nm laser for different periods. The data represents the mean ± s.d. of three independent experiments.

