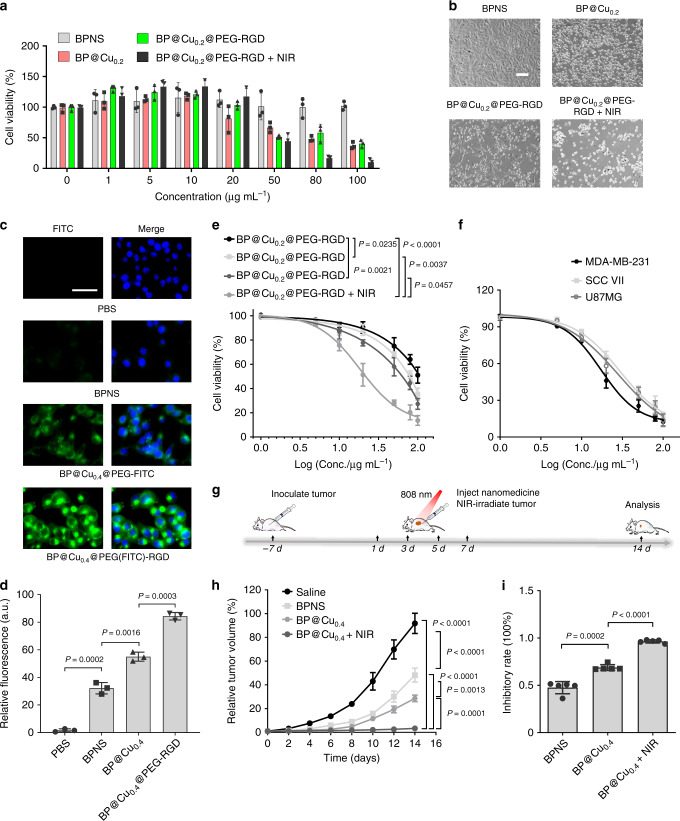
Fig. 4. Synergistic effects of BPNS and Cu2+ ions on killing cancer cells.
a Cell viabilities measured by MTT assay. B16F10 cells were subjected to various concentrations of BPNS, BP@Cu0.2, BP@Cu0.2@PEG-RGD, and BP@Cu0.2@PEG-RGD + NIR (n = 3). b Live-cell differential interface contrast imaging of B16F10 cells after incubation with BPNS, BP@Cu0.2, BP@Cu0.2@PEG-RGD, or BP@Cu0.2@PEG-RGD + NIR with the same amount of BPNS (100 ppm) for 48 h, respectively. Scale bars, 100 µm for all panels. c Confocal fluorescence images of live B16F10 cells incubating with PBS, BPNS (100 ppm), BP@Cu0.4@PEG-FITC (100 ppm BPNS), or BP@Cu0.4@PEG(-FITC)-RGD (100 ppm BPNS) for 6 h. Scale bar, 50 µm for all panels. Similar confocal fluorescence images were obtained for three independent experiments. d Relative FITC fluorescence in the cells. Mean ± s.d., n = 3. Unpaired two-tailed student’s t-test. e Comparison of the 48 h cytotoxicity of BP@Cu0.1, BP@Cu0.2, BP@Cu0.4, and BP@Cu0.4 plus 2 min of NIR laser irradiation against B16F10 cells (n = 3, analyzed by one-way ANOVA, followed by Tukey’s multiple comparisons post-test). f Relative cell viabilities of MDA-MB-231, SCC VII, and U87MG cancer cells after incubation with different concentrations of BP@Cu0.4@PEG-RGD. NIR laser irradiation was applied for 2 min after 4 h of incubation (n = 3). g Treatment schedule for in vivo cancer therapy by intratumoral injection of nanomaterials. h Relative tumor growth curves of the tumor receiving different treatments. Mice were intratumorally injected with 100 µL saline, BPNS, or BP@Cu0.4. One group of mice injected with BP@Cu0.4 received NIR laser irradiation at a density of 1 W cm−2 for 2 min at 4 h postinjection. The data represent mean ± s.d. (n = 5), analyzed by two-way ANOVA, followed by Tukey’s multiple comparisons post-test. (i) Inhibitory rates of B16F10 tumors at day 14 post-treatment. Mean ± s.d., n = 5. Analyzed by the unpaired two-tailed student’s t-test. All error bars in this figure indicate standard deviation.

