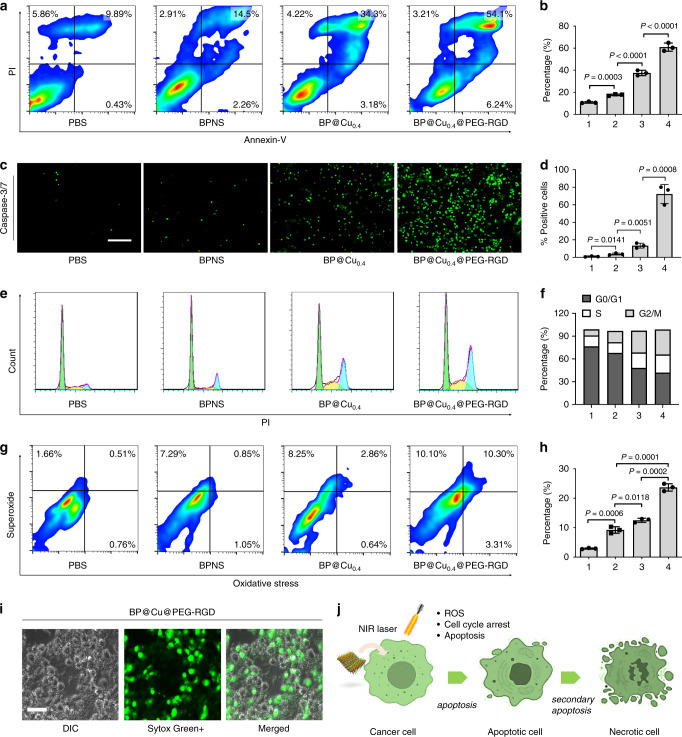
Fig. 5. Cellular effects of BP@Cu0.4@PEG-RGD in cancer cells.
B16F10 cells were treated with (1) PBS (control), (2) BPNS (100 ppm), (3) BP@Cu0.4 (100 ppm of BPNS), or (4) BP@Cu0.4@PEG-RGD (100 ppm of BPNS) for 24 h. NIR irradiation (808 nm, 1 W cm−2, 2 min) was applied to all cells after incubation for 4 h. a Annexin-V and PI double-staining flow cytometry analysis of the apoptosis of B16F10 cells. The data was processed by the Flowjo program. b Quantitative analysis of apoptotic cells after different treatments. The number 1–4 indicates was assigned to treatment groups indicated before. The same below. The data represent Annexin-V (+) cells. mean ± s.d., n = 3, unpaired two-tailed student’s t-test. c Activation of caspase-3/7 in B16F10 cells after treatment of PBS, BPNS, BP@Cu0.4, or BP@Cu0.4@PEG-RGD for 24 h. Scale bars, 100 µm for all panels. d Quantification of caspase-3/7 positive cells. The data represents mean ± s.d., n = 3 biologically independent experiments, unpaired two-tailed student’s t-test. e Cell-cycle distribution of B16F10 cells stained with propidium iodide and analyzed by flow cytometry. The data was processed by the Flowjo program. f Summary of cell percentage in each cell cycle phase, (1) PBS, (2) BPNS, (3) BP@Cu0.4, (4) BP@Cu0.4@PEG-RGD. g Flow cytometry analysis of cellular ROS/superoxide levels in B16F10 cells after different treatments. h Percentage of cells showing increased ROS/superoxide level after treatments. mean ± s.d., n = 3, unpaired two-tailed student’s t-test. i Sytox Green staining of B16F10 cells after treatment with BP@Cu0.4@PEG-RGD + NIR irradiation. Similar Sytox Green staining images were obtained for three independent experiments. j Probably cellular response after treatment with BP@Cu0.4@PEG-RGD.

