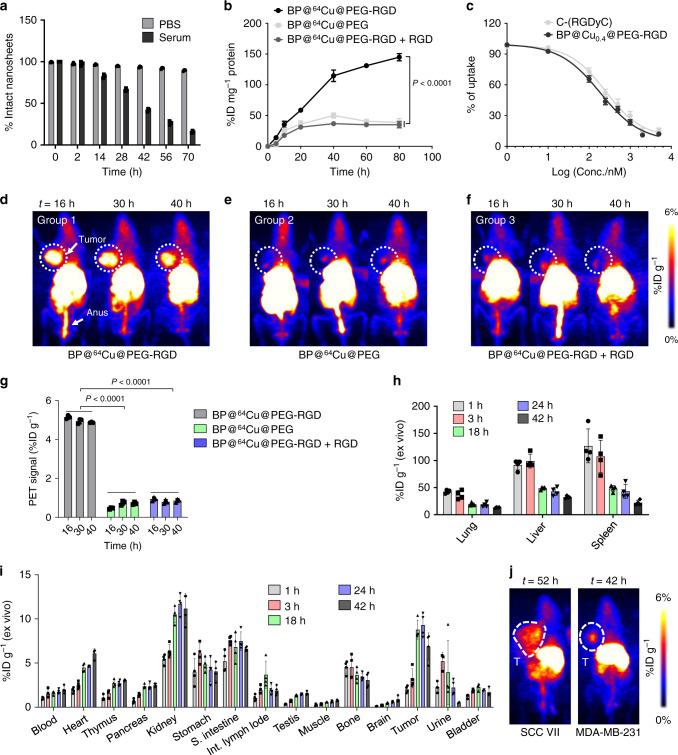
Fig. 6. Tumor-targeting properties of BP@64Cu@PEG-RGD.
a Stability of BP@64Cu@PEG-RGD in PBS and mouse serum. Data represents the mean ± s.d., n = 3. b Time-uptake curves of BP@64Cu@PEG-RGD, BP@64Cu@PEG, and BP@64Cu@PEG-RGD + RGD in B16F10 cells, mean ± s.d., n = 3. Analyzed by two-way ANOVA, followed by Tukey’s multiple comparisons post-test. c Competition binding of BP@64Cu@PEG-RGD by various concentrations of c(RGDyC) or BP@Cu@PEG-RGD. The data represents the mean ± s.d., n = 3 biologically independent cells. d–f MIP PET images of B16F10 tumor-bearing mice at 16, 30, and 40 h after intravenous injection of BP@64Cu@PEG-RGD, BP@64Cu@PEG, or BP@64Cu@PEG-RGD + RGD, respectively. For the BP@64Cu@PEG-RGD + RGD group, the c(RGDyC) peptide (5 mg/kg) was co-injected with BP@64Cu@PEG-RGD. The white circles denote the tumor sites. g Quantification of radioactivity in the tumor from the PET images. The data show mean ± s.d., n = 3. Analyzed by two-way ANOVA, followed by Tukey’s multiple comparisons post-test. h, i Ex vivo biodistribution of BP@64Cu@PEG-RGD in tumor and major organs of mice bearing B16F10 tumor at 1, 3, 18, 24, and 42 h p.i. Each point corresponds to mean ± s.d., n = 4. j MIP PET images of BP@64Cu@PEG-RGD in SCC VII and MDA-MB-231 tumor-bearing mice 52 or 42 h p.i., respectively. The white circles denote the tumor sites. All error bars in this figure indicate standard deviation.

