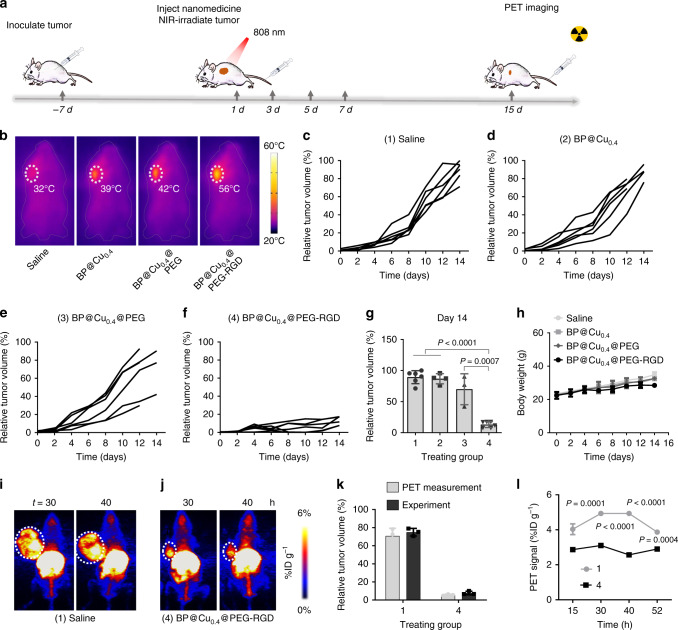
Fig. 7. In vivo tumor therapy.
a Therapy approach for tumor-bearing mice. b Infrared thermal images of tumor-bearing mice injected with (1) saline, (2) BP@Cu0.4, (3) BP@Cu0.4@PEG, or (4) BP@Cu0.4@PEG-RGD under 808 nm laser irradiation (1.0 W cm−2) for 2 min. The white circles denote the tumor sites. c–f B16F10 tumor growth curves for each mouse after different treatments: c saline, d BP@Cu0.4, e BP@Cu0.4@PEG, or f BP@Cu0.4@PEG-RGD. g Relative tumor volume after different treatments on day 14. mean ± s.d., n = 4–6 biologically independent mice. The number 1–4 was assigned different treatments indicated in (c–f). The same below. The statistical significance was assessed using unpaired two-tailed student’s t-test. h Body weight curves of B16F10 tumor-bearing mice after different treatments, mean ± s.d., n = 6. i, j MIP PET images of B16F10 tumor-bearing mice after 2 weeks of treatment with saline or BP@Cu0.4@PEG-RGD, respectively. PET images were taken at 30 and 40 h after intravenous injection of saline or BP@64Cu@PEG-RGD. The white circles denote the tumor sites. k Comparison of tumor volumes from PET images and experimental measurements, mean ± s.d., n = 3 biologically independent mice. l Quantification of BP@64Cu@PEG-RGD uptake in tumors at different time points. The PET signal intensities were analyzed based on PET images in (i) and (j). The data represents the mean ± s.d., n = 3 biologically independent mice. The error bars represent s.d. values. Analyzed by two-way ANOVA, followed by Bonferroni’s multiple comparisons test.

