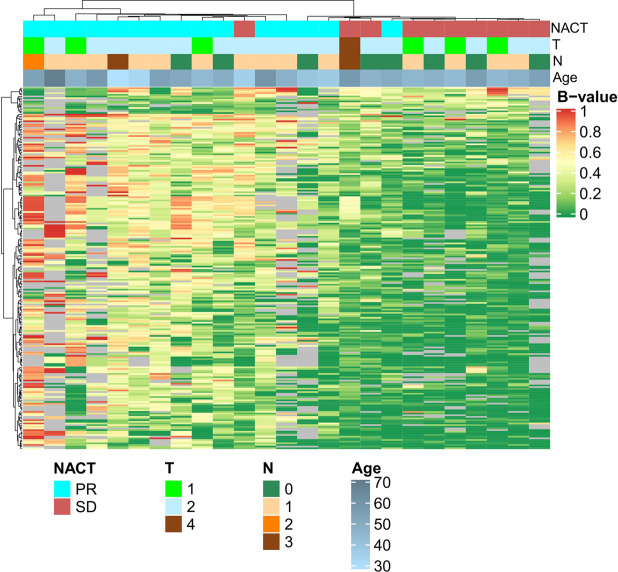
Figure 1.
The heat map of methylation levels (b-values) of CpG dinucleotides in luminal B breast cancer samples with different response to neoadjuvant chemotherapy (NACT) identified in this study using XmaI-RRBS method. The red bars and green bars represent hypermethylation CpG sites and hypomethylation CpG sites, respectively. Data are presented in a matrix format: each row represents a CpG dinucleotide differential methylation of which marks the differences in the responses of BC tumors to NACT, and each column, a tumor sample. Patients’ age, tumor size (T) and lymph node status (N), response to NACT are indicated as colored rectangles.

