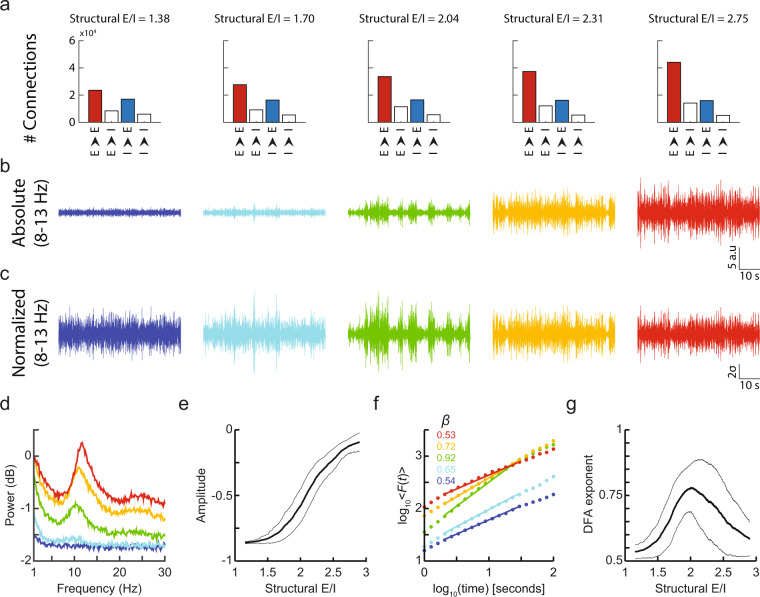
Figure 1.
Amplitude and long-range temporal correlations of oscillations strongly depend on structural E/I. (a) Number of connections between neuron types for five different networks with increasing structural E/I. (b) Network activity filtered in the 8–13 Hz band shows increasing oscillation amplitude with increasing structural E/I. (c) Z-scored activity of (b) shows differing temporal structure of oscillation amplitude for balanced and unbalanced networks. (d) Power spectrum for networks in (b). (e) Spectral amplitude in the 8–13 Hz band increases with structural E/I. Running mean amplitude values of 300 networks (thick line) +/− 1 standard deviation (thin lines). (f) Detrended fluctuation analysis (DFA) applied to the amplitude envelope of 8–13 Hz filtered signals in b shows increasing scaling exponents for balanced (green) compared to unbalanced networks (blue, red). (g) DFA exponents show an inverse u-shaped relationship with structural E/I.

