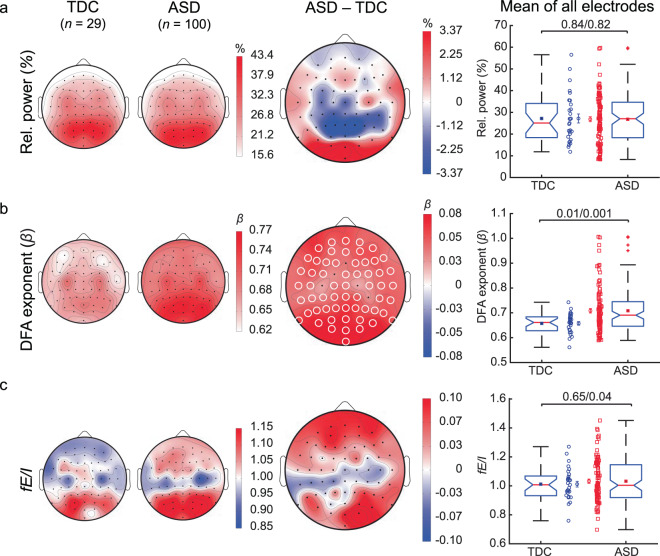
Figure 4.
Alpha oscillations in ASD are characterized by strong LRTC and large variability in fE/I. Grand-average topographies for the EEG biomarkers are shown for TDC (first column), ASD (second column), and for ASD-minus-TDC (third column). (a) Relative power (RP) showed the characteristic occipito-parietal distribution both in TDC and ASD. (b) Whole-brain average and variability of LRTC quantified by the DFA exponent were both larger in ASD compared to TDC. (c) A pronounced variability of whole-brain fE/I was evident in ASD. White circles on the topographies represent significant channels (i.e., p-value < 0.05, using Wilcoxon rank-sum test and FDR correction). The fourth column shows individual-subject values, boxplots, and mean and SEM for TDC (blue circles) and ASD (red squares). Comparisons represented in boxplots were based on the average value of the EEG biomarkers across all 64 electrodes, each data point represents one subject (whole-head average; p-values are from Wilcoxon rank-sum test (mean)/Levene’s test (variability).

