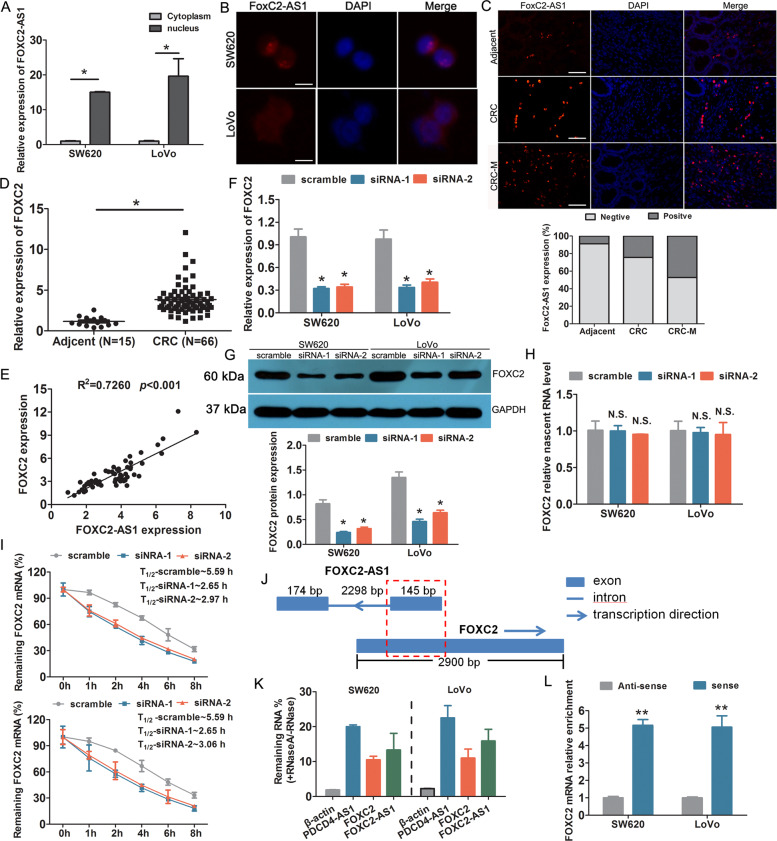
Fig. 4. FOXC2-AS1 positively regulated FOXC2 expression via enhancing FOXC2 mRNA stability.
a The relative expression of FOXC2-AS1 in the cytoplasm and nucleus of SW480 and LoVo cells. FISH detection was used to investigate the location of FOXC2-AS1 in cells (b) and tissues (c). Scale bars = 100 μm. d The expression of FOXC2 was examined in 66 CRC and 15 adjacent normal tissues. e The expression relationship between FOXC2-AS1 and FOXC2 was analyzed in 66 CRC tissues. FOXC2 expression was examined in FOXC2-AS1-silenced SW480 and LoVo cells by qRT-PCR method (f) and Western blot (g). h qRT-PCR detected the levels of nascent FOXC2 pre-mRNA with Click-iT Nascent RNA Capture Kit in FOXC2-AS1-silenced and control cells. i qRT-PCR investigated FOXC2 mRNA stability in FOXC2-AS1-silenced and control cells treated with the transcriptional inhibitor actinomycin D (50 ng/ml) for different times. j Schematic diagram of FOXC2-AS1 and FOXC2 gene locus and structure. The red grid represents the completely complementary region. The number represents the length of exon or intron. k qRT-PCR was conducted to analyze RNase protection experiment. β-actin was used as a negative control, while PDCD4-AS1 was used as a positive control. l qRT-PCR was performed to assess the interaction between FOXC2 and biotin-labeled FOXC2-AS1 after RNA pull-down assay. *P < 0.05, ***P < 0.001, N.S. indicates not statistically different.

