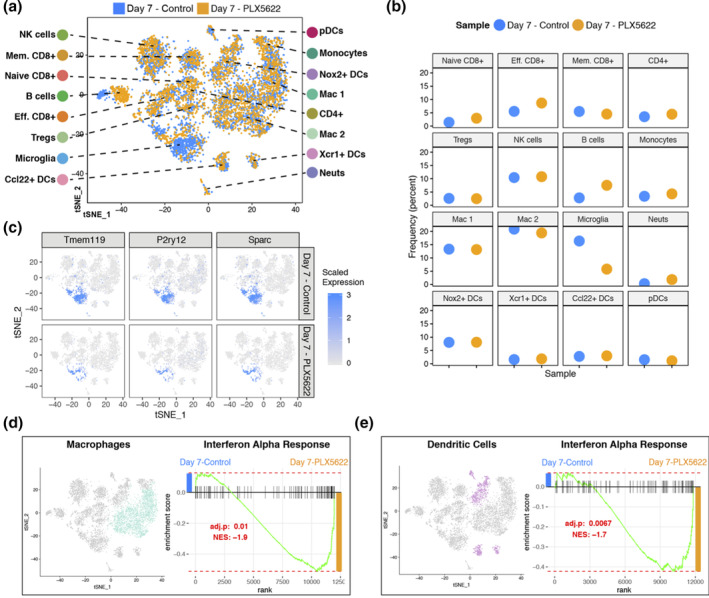
FIGURE 3.

PLX5622 treatment and immune cell infiltration into the CNS at day 7 p.i. (a) t‐SNE plot showing the immune landscape in brains of control‐(blue) and PLX5622‐(orange) treated animals at 7 days p.i. (b) Frequency of cell clusters in brains of control‐ and PLX5622‐treated animals at 7 days post JHMV infection. (c) t‐SNE plot showing decreased expression of microglia‐associated transcripts Tmem119, P2ry12, and Sparc in PLX5622 mice compared with controls. Gene set enrichment analysis (GSEA) for IFN‐α responses in combined (d) macrophage (teal) and (e) dendritic cell (purple) populations isolated at day 7 from brains of JHMV‐infected mice treated with either PLX5622 or control chow, represented in t‐SNE plots. Area under the curve represents enrichment of response genes. Responses to IFN‐α were enriched in both macrophages and dendritic cells isolated from brains of PLX5622 mice compared with control animals at day 7 p.i. Normalized enrichment scores and p values are shown
