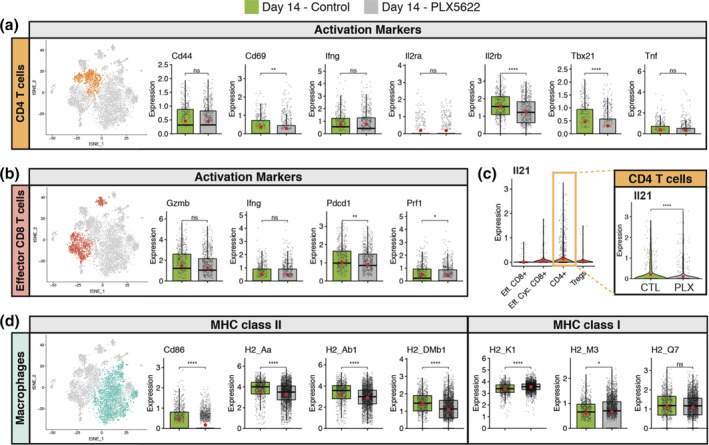
FIGURE 6.

Muted activation profiles of spinal cord CD4+ T cells isolated from PLX5622‐treated mice at day 14 p.i. JHMV‐infected mice treated with either control chow or PLX5622 were sacrificed at day 14 p.i. and CD45+ cells sorted from spinal cords to evaluate mRNA expression profiles via scRNASeq. (a) CD4+ T cells from spinal cords of mice treated with PLX5622‐treated or control mice, comparing expression of transcripts encoding for activation markers Cd44, Cd69, Il2ra, Il2rb, Tbx21, Ifng, and Tnf. (b) Expression levels of transcripts encoding effector and activation markers in CD8+ T cells Prf1, Pdcd1, Gzmb, and Ifng. (c) Violin plots depicting expression of Il21 transcripts within T cell populations isolated from the spinal cords of experimental mice; expression is reduced (p < .0001) in CD4+ T cells from PLX5622‐treated mice compared to controls. (d) Expression of MHC class II‐associated genes (H2‐Aa, H2‐Ab1, and H‐2DMb1) and co‐stimulatory molecule Cd86, as well as MHC class I‐associated genes (H2‐K1, H2‐M3, and H2‐Q7), are shown in macrophages from experimental mice. In these plots, each dot represents a single cell. Normalized expression values were used and random noise was added to show the distribution of data points. The box plot shows interquartile range and the median value (bold horizontal bar). Average expression per sample is represented by the red dot. Wilcoxon test was used for statistical analysis. ns, not significant; *p ≤ .05; ** p ≤ .01; ****p ≤ .0001
