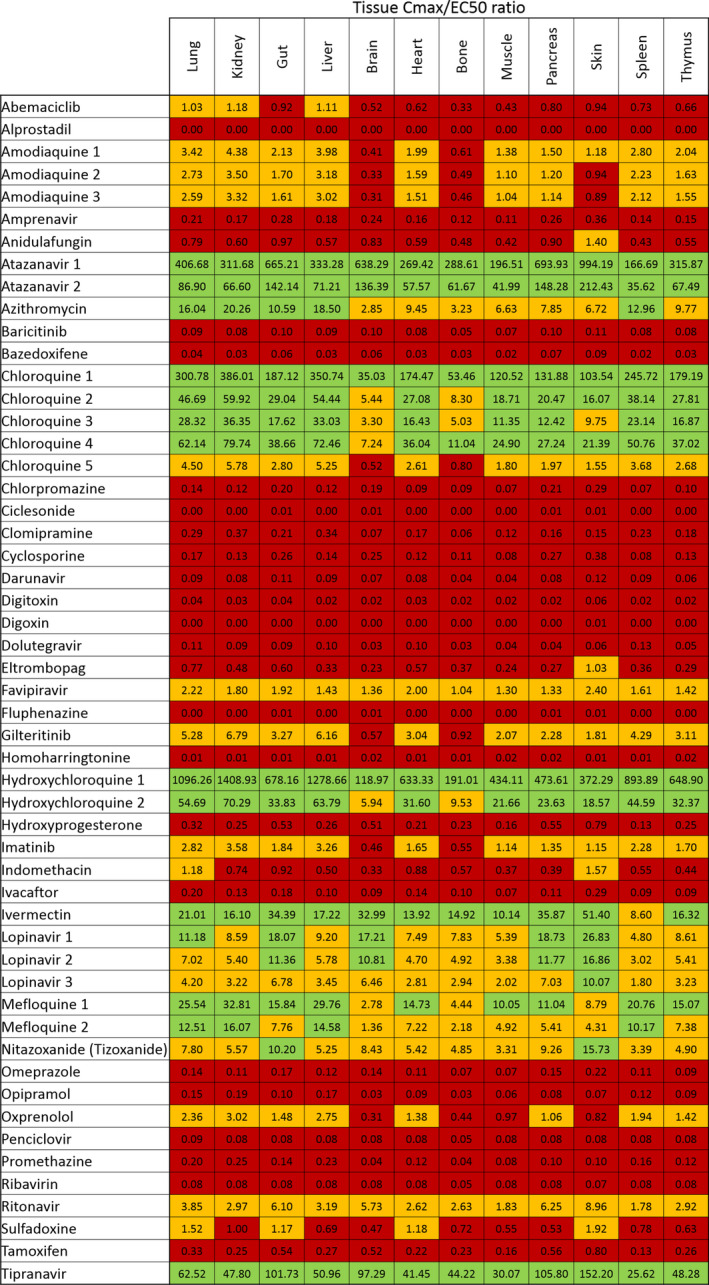
Figure 5.

A heatmap displaying the simulated tissue peak plasma concentration (Cmax)/half‐maximal effective concentration (EC50) values for all drugs with available data. Those drugs with a ratio above 1 (shown in orange) were estimated to provide tissue concentrations sufficient to exert at least some antiviral activity at their approved dose. Drugs shown in green were predicted to exceed tissue concentrations over their EC50 by > 10‐fold.
