
Figure 1.
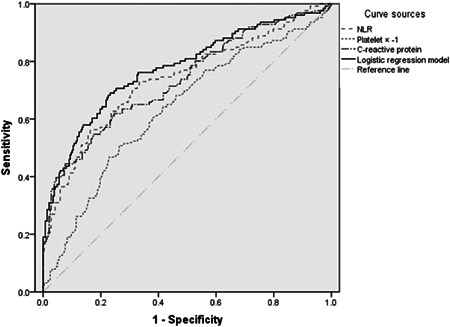
ROC curves of NLR, platelet, CRP, and logistic regression model in patients with severe COVID‐19. CRP, C‐reactive protein; NLR, neutrophil‐to‐lymphocyte ratio; ROC, reactive oxygen curve
Official websites use .gov
A
.gov website belongs to an official
government organization in the United States.
Secure .gov websites use HTTPS
A lock (
) or https:// means you've safely
connected to the .gov website. Share sensitive
information only on official, secure websites.
ROC curves of NLR, platelet, CRP, and logistic regression model in patients with severe COVID‐19. CRP, C‐reactive protein; NLR, neutrophil‐to‐lymphocyte ratio; ROC, reactive oxygen curve