
Figure 1.
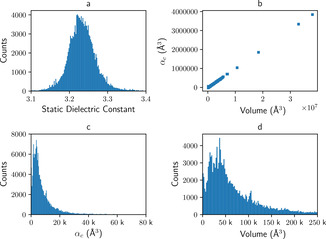
a) Histogram of the static dielectric constants ϵr of all proteins in the PDB database. b) Correlation between the average polarizabilities and volumes of the proteins. c) Histogram of the average polarizabilities of the proteins. d) Histogram of the molecular volume of the proteins.