
Figure. 2.
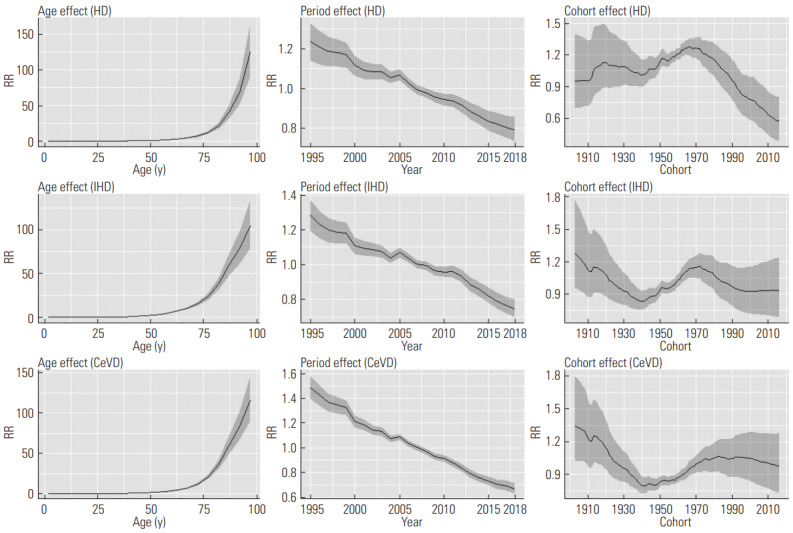
Results of age-period-cohort analysis of heart disease (HD), ischemic heart disease (IHD), and cerebrovascular disease (CeVD) for men. The y-axis indicates the rate ratio (RR) among the effects. Solid lines signify estimates of each effect, and the shadings show credible intervals of each effect. A 95% credible interval indicates the interval where the true value of the estimate is included with a probability of 95%.