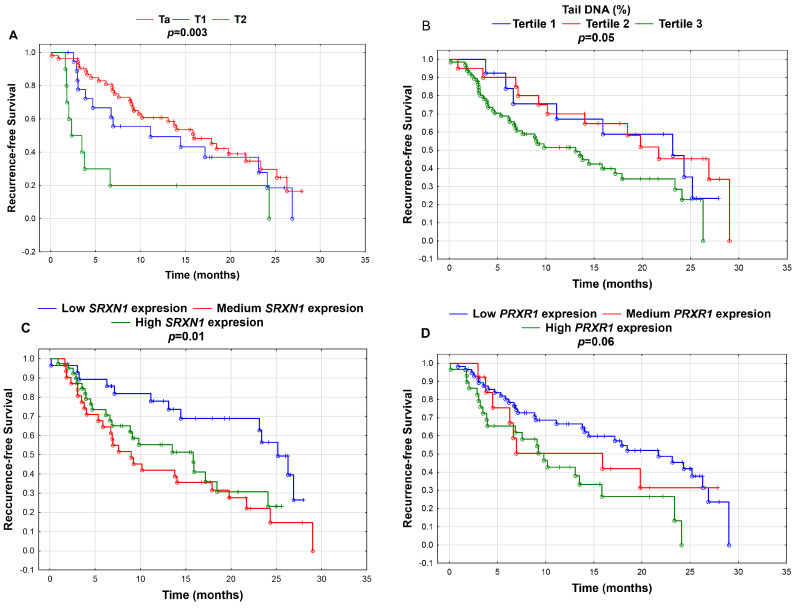
Figure 1.
Kaplan–Meier curves for recurrence-free survival according to (A) tumor stage (Ta, T1, T2); (B) tertiles of tail DNA (%)—Tertile 1 (≤3.74% Tail DNA; N = 7), Tertile 2 (3.75–5.11% Tail DNA; N = 24) and Tertile 3 (>5.1% Tail DNA; N = 91); (C) tertiles of gene expression of SRXN1—low SRXN1 expression (≤7.68; N = 35), medium SRXN1 expression (7.68–8.03; N = 35) and high SRXN1 expression (>8.03; N = 52); and (D) tertiles of gene expression of PRDX1—low PRDX1 expression (≤9.47; N = 66), medium PRDX1 expression (9.47–9.61; N = 16) and high PRDX1 expression (>9.61; N = 40). P-values were calculated by the log-rank test; p < 0.05.

