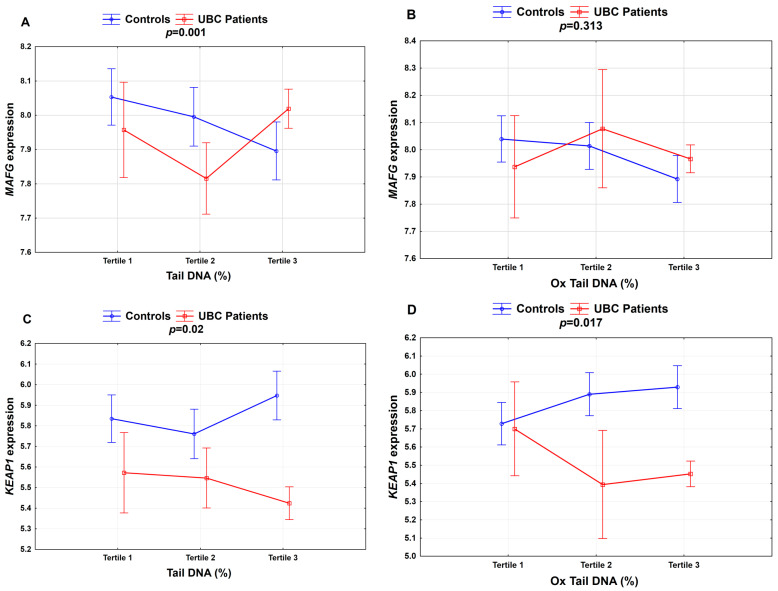
Figure 2.
Association between DNA damage and selected cytoprotective gene expression in the study group for (A) MAFG; (C) KEAP1—Tertile 1 (≤3.74% Tail DNA; N = 7), Tertile 2 (3.75–5.11% Tail DNA; N = 24) and Tertile 3 (>5.1% Tail DNA; N = 91); (B) MAFG; and (D) KEAP1—Tertile 1 (≤6.21% Ox Tail DNA; N = 8), Tertile 2 (6.22–7.37% Ox Tail DNA; N = 6) and Tertile 3 (>7.37% Ox Tail DNA; N = 108). p-values were calculated by the two-way ANOVA p < 0.05; the percentages of DNA damage (Tail DNA) and oxidative DNA damage (Ox Tail DNA).

