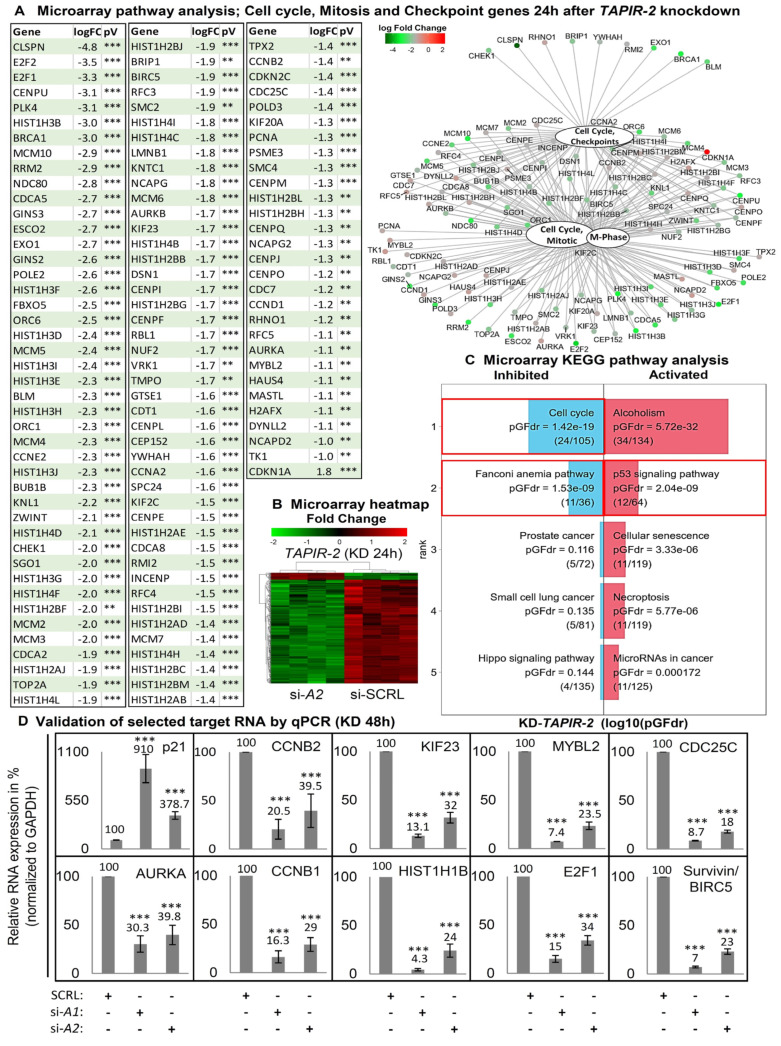
Figure 4.
Increase in p53 levels and downregulation of cell cycle and DNA repair control genes following TAPIR-2 knockdown. (A) Differential mRNA expression following TAPIR-2 knockdown. A microarray analysis was performed 24 h after TAPIR-2 knockdowns. Data were analyzed and visualized using ReactomePA software to identify regulated target genes and cellular processes. ReactomePA is a pathway database tool used for the visualization, interpretation, and analysis of regulated pathways. A table shows all cell cycle, mitosis, and checkpoint regulated genes 24 h after TAPIR-2 knockdown. Notably, this table includes 117 of the total 276 significantly regulated genes. Adjusted p-values are given as p ≤ 0.01 (**) and p ≤ 0.001 (***). Regulatory interactions are visualized using the function cnetplot of the ReactomePA package. An enlarged version of the graph is provided as Figure S9. Downregulated genes are shown in green, upregulated genes in red. Shown are the identified regulated genes of the four most regulated cellular processes: cell cycle, mitotic, m-phase, and cell cycle checkpoints. Interactions of molecules are indicated by black lines. (B) Heatmap of differentially up- and down-regulated TAPIR-2 target genes 24 h post siRNA transfection, determined using microarray analysis (performed in quadruplicates). Significant upregulated genes are shown in red, downregulated genes in green. Note that ~95% of the targets are downregulated. (C) Microarray signaling pathway impact analysis (SPIA). Transcriptome wide RNA expression patterns of siRNA treated LNCaP cells (each experiment was performed in quadruplicates) were measured using custom expression microarrays 24 h after transfection. The biological pathways extraction was done using the Kyoto Encyclopedia of Genes and Genomes (KEGG) PATHWAY database. Downregulation of cell cycle and Fanconi anemia pathway genes (left red boxes) and upregulation of the p53 signaling pathway (right red box) is shown. The false discovery rate-adjusted global probability (pGFdr) is given. (D) Validation of the microarray-determined expression patterns of cell cycle regulating target RNAs after TAPIR knockdown using qPCR. Total RNA was isolated from LNCaP cells 48 h post siRNA transfection and reverse transcribed into cDNA. qPCR was performed to quantify p21CIP1/CDKN1A, CCNB1, CCNB2, KIF23, MYBL2, CDC25C, AURKA, HISTH1B, E2F1, and Survivin/BIRC5. The ∆Ct values were determined by subtracting the Ct value of the housekeeper Ct value (GAPDH). Each qPCR reaction was performed in triplicate with at least three independent biological replicates. Data are shown as means ± s.d.; Significance p ≤ 0.001 (***); two-sided student-t test. Similar data are obtained for TAPIR-1 knockdown, shown in Figures S10 and S11.

