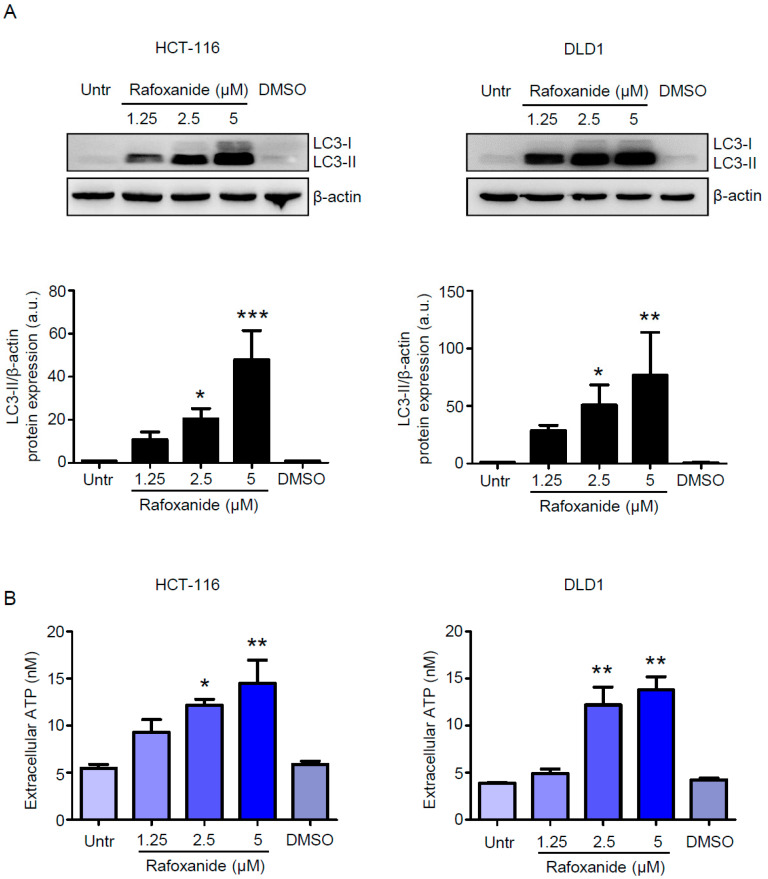
Figure 2.
Rafoxanide induces autophagy and ATP release in CRC cells. (A) Western blotting for LC3 in extracts of HCT-116 and DLD1 cells either left untreated (Untr) or treated with either DMSO (vehicle) or rafoxanide for 24 h. β-actin was used as loading control. The full blots are available in Figure S3 from Supplementary Materials. One of three experiments in which similar results were obtained is shown. Lower insets: Quantitative analysis of LC3-II/β-actin protein ratio in total extracts of HCT-116 and DLD1 as measured by densitometry scanning of Western blots. Values are expressed in arbitrary units (a.u.) and are the mean ± SD of three experiments. Data were analyzed using one-way analysis of variance (ANOVA) followed by Dunnett’s post hoc test. DMSO vs. rafoxanide-treated cells, * p < 0.05, ** p < 0.01, *** p < 0.001. (B) Histograms showing the amount of released ATP in the medium supernatant of HCT-116 and DLD1 cells either left untreated (Untr) or treated with either DMSO or rafoxanide for 24 h. Data are expressed as mean ± SD of three experiments. Data were analyzed using one-way analysis of variance (ANOVA) followed by Dunnett’s post hoc test. DMSO vs. rafoxanide-treated cells, * p < 0.05, ** p < 0.01.

