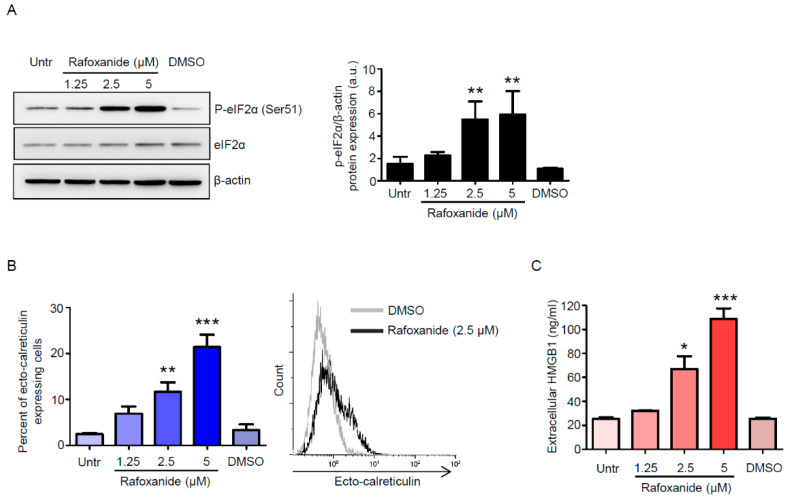
Figure 5.
Rafoxanide induces immunogenic cell death markers in CT26 cells. (A) Representative western blotting for p-eIF2α (Ser51) and eIF2α in extracts of CT26 cells either left untreated (Untr) or treated with either DMSO (vehicle) or rafoxanide for 30 min. β-actin was used as loading control. The full blots are available in Figure S4 from Supplementary Materials. One of three experiments where similar results were obtained is shown. Right inset: Quantitative analysis of p-eIF2α (Ser51)/β-actin protein ratio in total extracts of CT26 as measured by densitometry scanning of Western blots. Values are expressed in arbitrary units (a.u.) and are the mean ± SD of three experiments. Data were analyzed using one-way analysis of variance (ANOVA) followed by Dunnett’s post hoc test. DMSO vs. rafoxanide-treated cells, ** p < 0.01. (B) Histograms showing the percentage of ecto-calreticulin-expressing CT26 cells either left untreated (Untr) or treated with either DMSO or rafoxanide for 6 h. Results indicate the percentage of ecto-calreticulin-expressing cells as assessed by flow-cytometry analysis. Data are expressed as mean ± SD of three experiments. Data were analyzed using one-way analysis of variance (ANOVA) followed by Dunnett’s post hoc test. DMSO vs. rafoxanide-treated cells, ** p < 0.01, *** p < 0.001. Right inset. Histograms showing ecto-calreticulin in CT26 treated with either DMSO or rafoxanide as assessed by flow-cytometry. (C) Amount of released HMGB1 in the medium supernatant of CT26 cells either left untreated (Untr) or treated with either DMSO or rafoxanide for 48 h. Data are expressed as mean ± SD of two experiments. Data were analyzed using ANOVA followed by Dunnett’s post hoc test. DMSO vs. rafoxanide-treated cells, * p < 0.05, *** p < 0.001.

