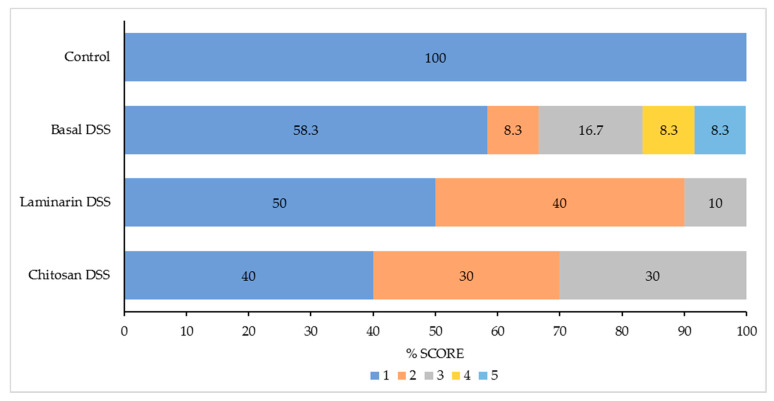
Figure 1.
The distribution of the pathology scores between the treatment groups in %. The scoring system was as follows: 1 = normal, non-ulcerating epithelium with a reduced lamina proprial cell infiltration; 2 = normal with a lamina proprial cell infiltration within the normal spectrum; 3 = colonic samples with focal (single) regions of ulceration and 4 = samples with multiple foci of ulceration interspersed between regions of normal colon and 5 = samples with diffuse ulceration. The pathology scores are represented as: score 1 (■), score 2 (■), score 3 (■), score 4 (■) and score 5 (■).

