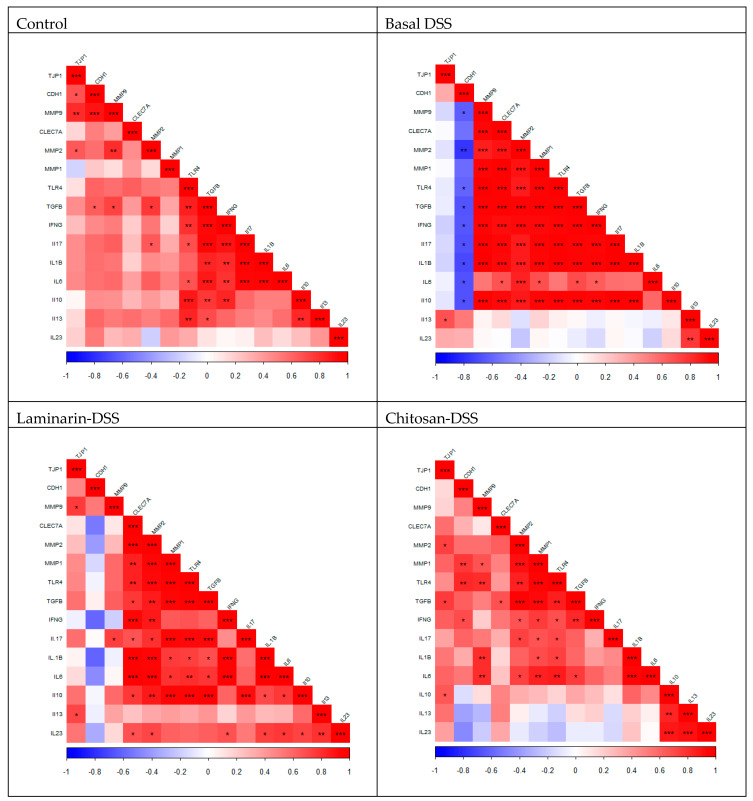
Figure 2.
Gene expression correlation matrices for each treatment group. This figure shows the correlation between the measured genes in each treatment group. Positive correlations are indicated in red, while the negative correlations are indicated in blue. The depth of the colour indicates the strength of the positive/negative correlation (0–1). TJP1, tight junction protein 1; CDH1, cadherin 1; MMP9, matrix metalloproteinase 9; CLEC7A, C-type lectin domain containing 7A; MMP2, matrix metalloproteinase 2; MMP1, matrix metalloproteinase 1; TLR4, Toll-like receptor 4; TGFB1, transforming growth factor beta 1; IFNG, interferon gamma; IL17A, interleukin 17A; IL1B, interleukin 1B; IL6, interleukin 6; IL10, interleukin 10; IL13, interleukin 13; IL23A, interleukin 23 subunit alpha. * p < 0.05; ** p < 0.01; *** p < 0.001.

