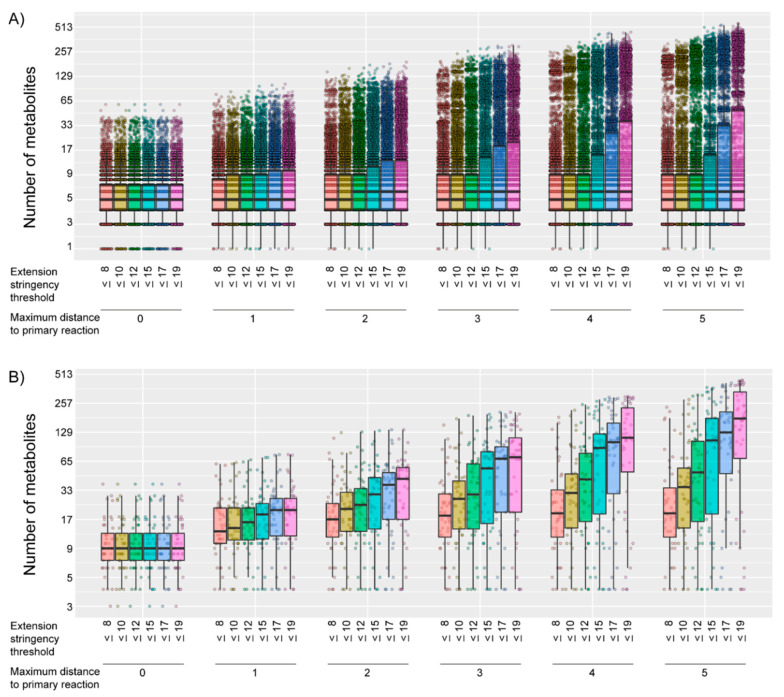
Figure 1.
Number of metabolites on a logarithmic scale (log2 (“number of metabolites” + 1)) within the gene-specific metabolite set, for (A) all 7033 genes and (B) each of the 44 disease-causing genes with a gene-specific metabolite set that consisted of at least 1 metabolite in any parameter combination. The number of metabolites is stratified by the first studied parameter: maximum distance to the primary reaction and by the second studied parameter: the extension stringency threshold. Boxplots indicate the distribution of the number of metabolites in the gene-specific metabolite sets. Each dot represents one gene-specific metabolite set.

