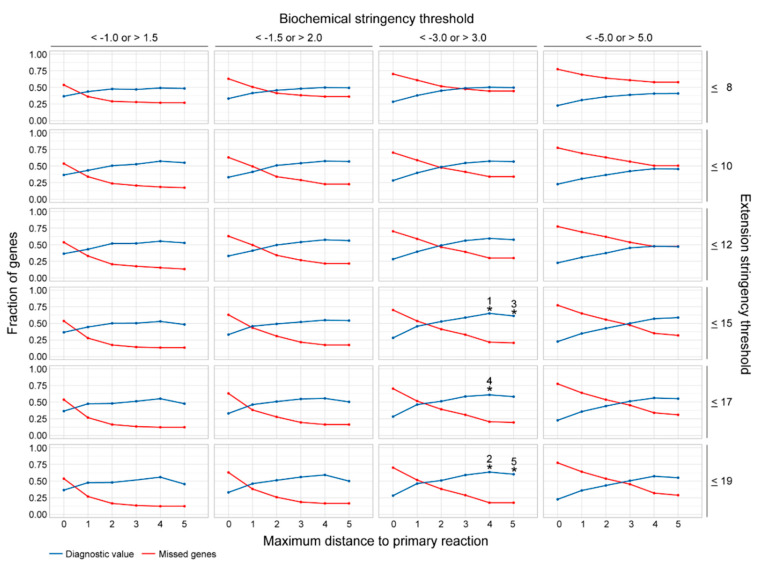
Figure 2.
Assessment of the most favorable parameter combination for the cross-omics method. The diagnostic value of the cross-omics method for the different parameter combinations is depicted in blue, the fraction of missed disease-causing genes is depicted in red. The five parameter combinations reaching the highest diagnostic value are highlighted with numbered asterisks: 1: 0.65; 2: 0.64; 3: 0.61; 4: 0.61; 5: 0.60).

