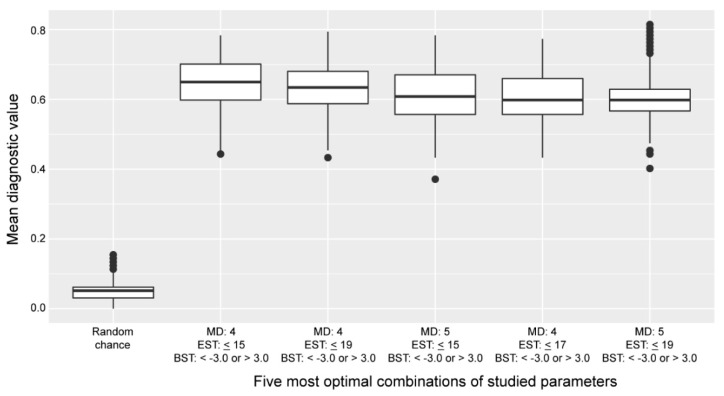
Figure 4.
Distribution of the diagnostic values of the five most favorable parameter combinations of the cross-omics method compared to the diagnostic value if based on random chance. Boxplots indicate the distribution of the diagnostic values over 1000 cross-omics analyses. Abbreviations: BST, biochemical stringency threshold; EST, extension stringency threshold; MD, maximum distance to the primary reaction.

