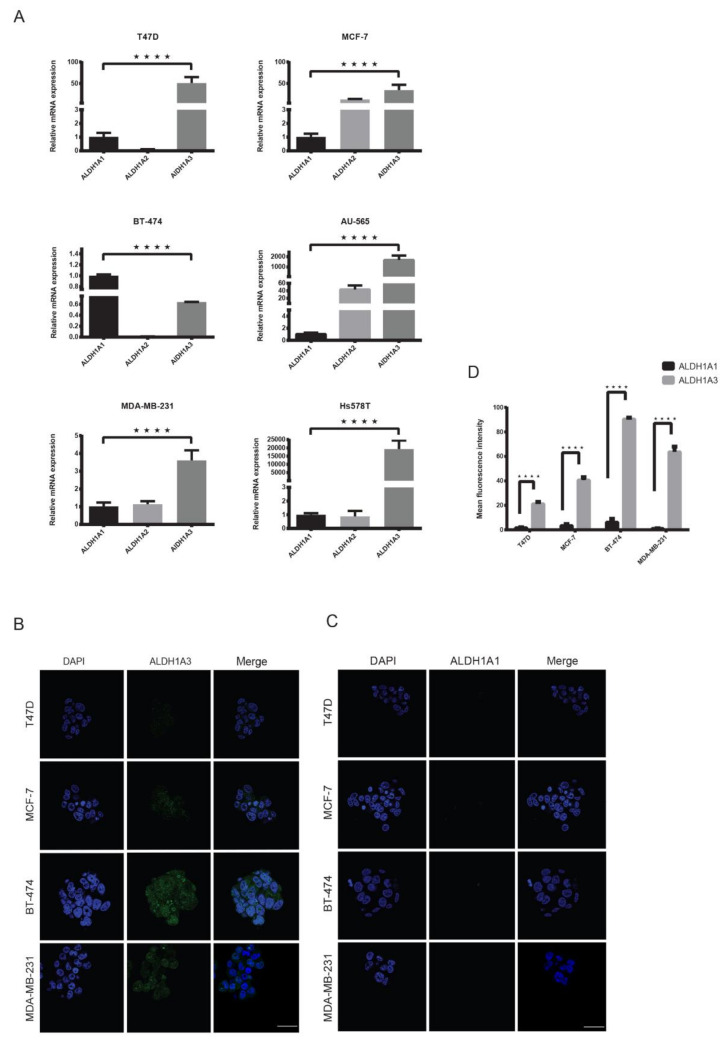
Figure 4.
High expression of ALDH1A3 in breast cancer cell lines. (A) Relative mRNA expression analysis of ALDH1A1, ALDH1A2 and ALDH1A3 in breast cancer cell lines using qRT-PCR showing a significantly higher expression of ALDH1A3 in all cell lines except BT-474. mRNA expression was normalized to ALDH1A1. (B,C) Representative image and analysis of immunofluorescence for ALDH1A3 and ALDH1A1 expression in mammospheres showing a significantly higher expression of ALDH1A3. Mammospheres formed after 7 days were separately stained with DAPI (blue), anti-ALDH1A1 (green) and anti-ALDH1A3 (green) antibodies. (D) Comparison of A1 and A3 immunofluorescence. Scale bar = 100 μm. Data represent the mean ± SD of three independent experiments; **** p < 0.0001.

