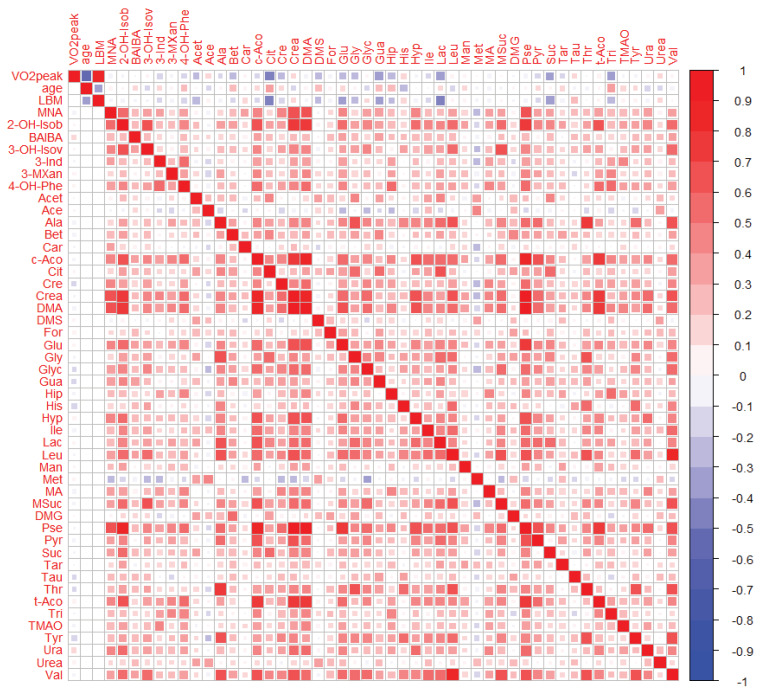
Figure A2.
Heat map of correlations between pre-exercise urinary metabolites, VO2peak, age, and LBM. Right/Up: Unadjusted bivariate associations. Left/Low: Partial associations adjusted for age, sex, menopausal status, and LBM. Pearson correlations were performed on Van der Waerden-transformed data.

