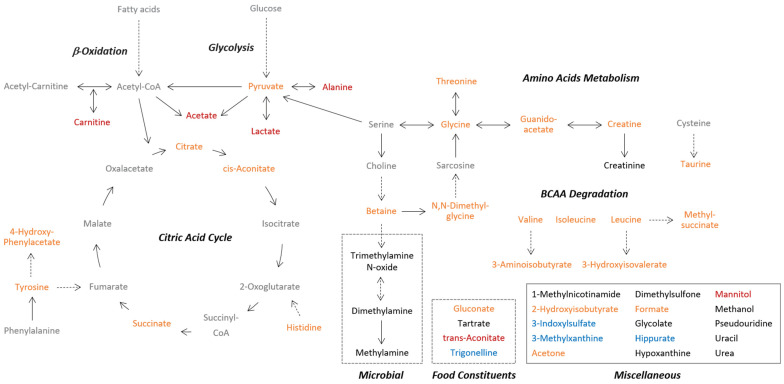
Figure A4.
Pathways and origin of identified metabolites. The post-exercise changes of the urinary metabolites are color coded as follows: red, FC ≥ 1.5 and FDR-corrected p < 0.05; orange: 1.5 > FC ≥ 1.1 and FDR-corrected p < 0.05; black: 1.1 > FC > or FDR-corrected p ≥ 0.05; blue: FC ≤ and FDR-corrected p < 0.05; grey: undetected metabolites. BCAA: branched-chain amino acids, FC: fold change between normalized post- and pre-exercise urinary metabolite concentrations, FDR: false discovery rate, p: p-value obtained by Wilcoxon‘s signed-rank test to analyze significant pre-to-post-exercise differences.

