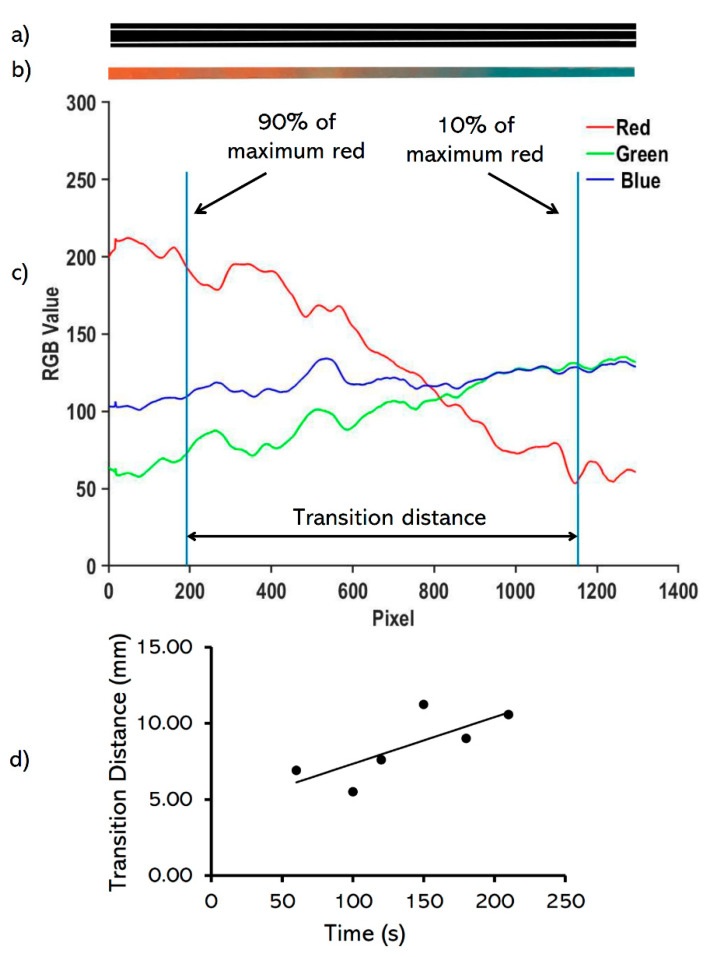
Figure 2.
Image analysis of the printed red and blue bioinks. (a) converting of the cropped image to black and white to detect the filament edges, (b) cropping the transition area of the printed pattern, (c) determining the transition distance within 90% of the maximum red value to 10% of the maximum red value while switching from red to blue (d) identifying the rate of change in the transition distance (Dtr = 0.03060 × t), where Dtr is the transition distance (in mm) and t is time (in·s).

