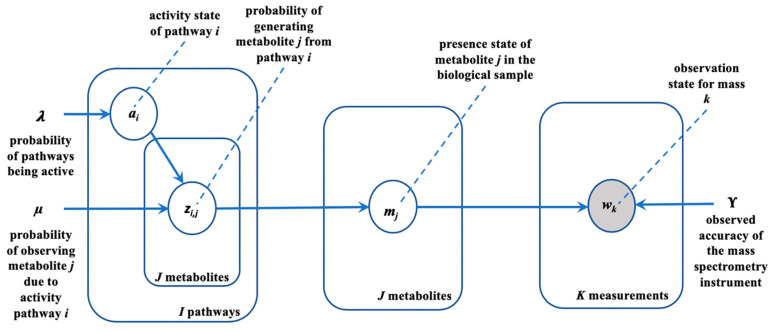
Figure 3.
Graphical representation of the generative model. To avoid representing all pathways, metabolites, and masses in the graph we use the ‘plate’ notation and draw one representative node per variable and enclosing these variables in a plate (rectangular box). The number of instances of each enclosed variable is indicated by the fixed constant in the lower right corner of the box. Random variables of the model (a, z, m, w) are shown in white circles. The variable m has a deterministic relationship with Z. The shaded circle, labelled w, represents an observed random variable. are parameters to the model.

