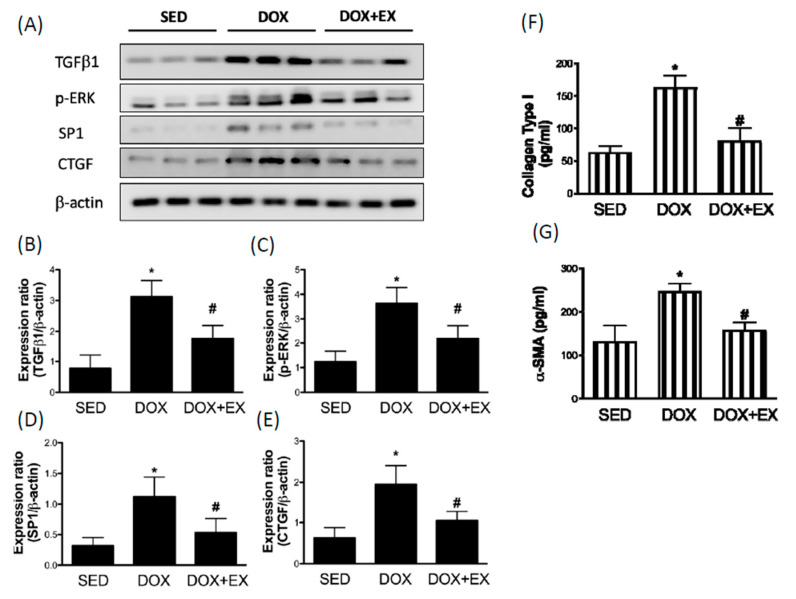
Figure 2.
The effect of treadmill exercise on the DOX-driven upregulation of fibrosis factors Representatives of Western blot (A) and the densitometric analysis of TGF-β1 (B), phosphorylated ERK (C), Sp1 (D), and CTGF (E). The collagen type I (F) and α -SMA (G) were tested by ELISA. * p < 0.05 compared to the SED group. # p < 0.05 compared to the DOX group. Detailed information about Figure 2A can be found at Figure S2.

