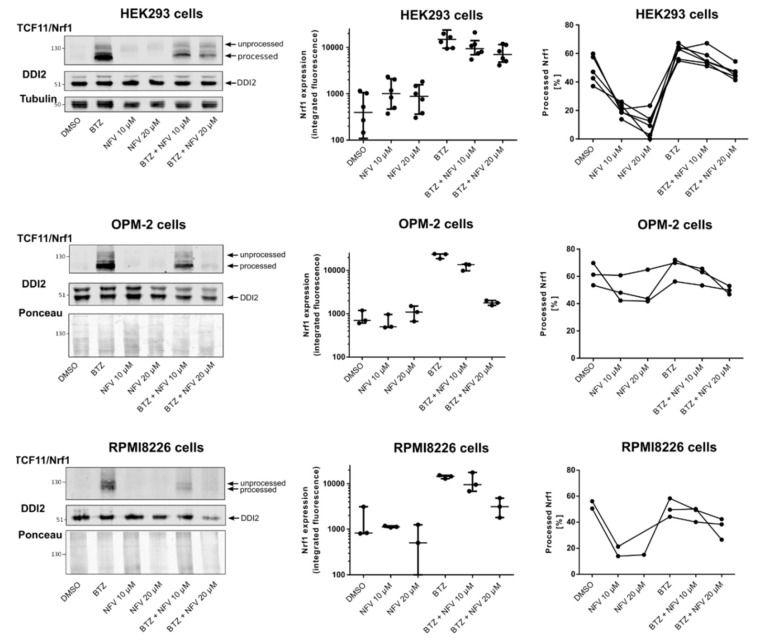
Figure 3.
Nelfinavir inhibits TCF11/Nrf1 proteolytic processing. HEK293 cells and OPM-2 and RPMI8226 MM cells were treated with 10 μM or 20 μM nelfinavir alone or in combination with 200 nM BTZ (HEK293 cells) or 20 nM BTZ (OPM-2, RMPI8226 cells) for 16 h. Cells were lysed and subjected to immunoblot analysis visualizing TCF11/Nrf1, DDI2, and tubulin as the loading control for HEK293 cells. Ponceau staining was used as a loading control for myeloma cells. Total Nrf1 expression was quantified from the integrated fluorescence of corresponding TCF11/Nrf1 bands normalized to tubulin or the Ponceau loading control. The processed (activated) form of Nrf1 was quantified as shown as [%]. Data from six (HEK293 cells) and three (OPM-2, RPMI8226 cells) independent experiments are shown.

