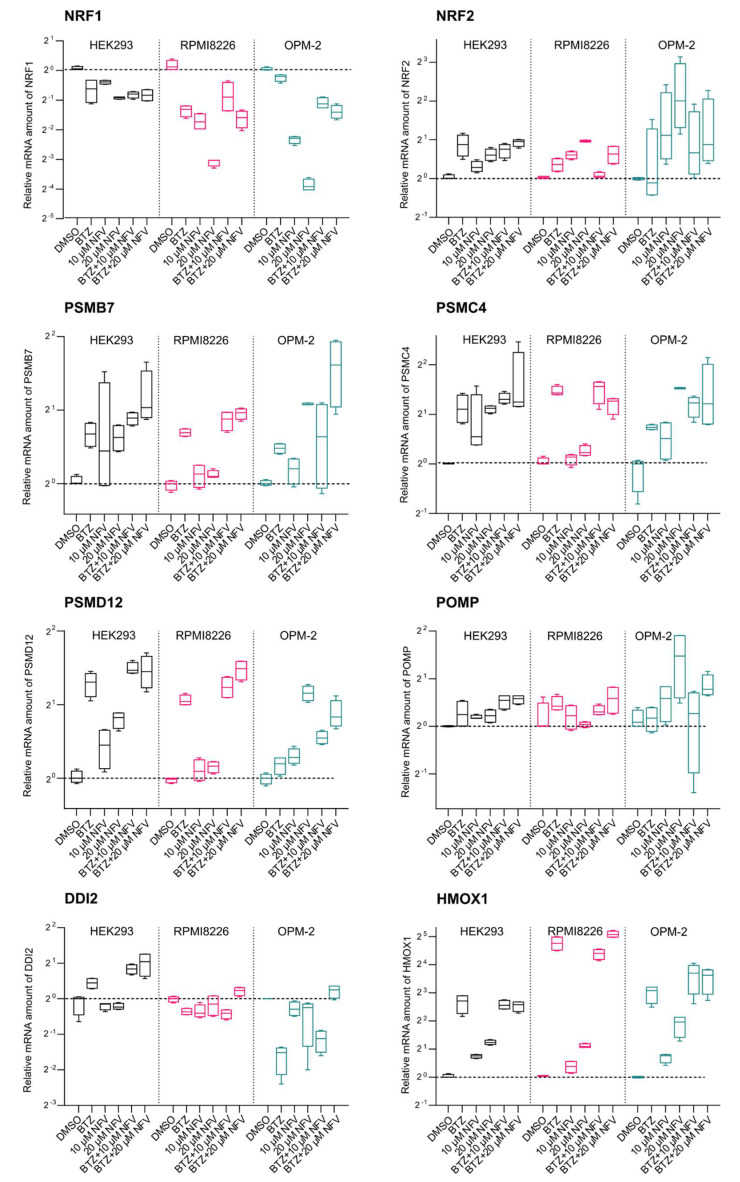
Figure 4.
Nelfinavir decreases TCF11/Nrf1 gene expression and activates Nrf2. Quantitative RT-PCR analyses of the indicated genes are shown. HEK293, RPMI8226, and OPM-2 cells were treated with 200 nM BTZ (HEK293 cells) or 20 nM BTZ (RPMI8226, OPM-2 cells), 10 μM or 20 μM NFV, or a combination for 16 h. RNA extracted from the cells was converted to cDNA and used for RT-qPCR with the primers listed in Table S1. mRNA levels of GAPDH were used for normalization. The boxes indicate interquartile ranges, while whiskers denote minimal and maximal values (n = 4).

