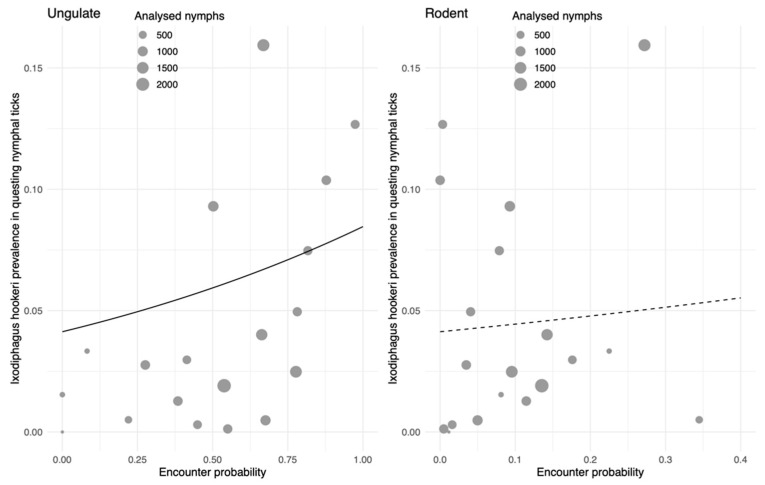
Figure 2.
Association of vertebrate species groups (ungulates and rodents) with the occurrence of I. hookeri in questing nymphs in the 19 forest sites. The occurrence is presented as the infestation prevalence of I. hookeri in questing nymphs (density of infected nymphs; DIN) at each site of 1200 m2. Horizontal axis: a function of encounter rates (see methods). A circle represents a single forest site. Best-fit beta binomial model is visualized by a solid line (a significant relationship to the host species, p = 0.018) or a dashed line (not significant, p = 0.7).

