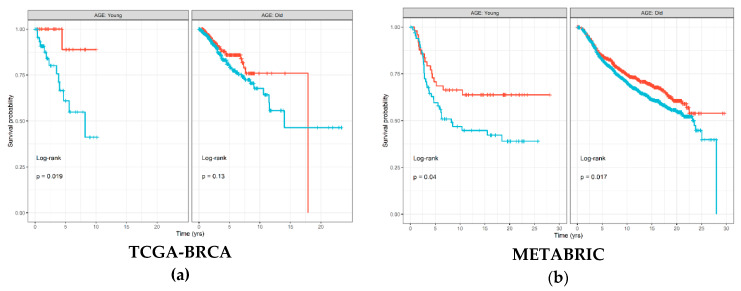
Figure 2.
Disease-free survival Kaplan–Meier (KM) curve for: (a) TCGA-BRCA; and (b) METABRIC cohorts, grouped by age groups and stratified by high (red) and low (blue) CD8+ T cell levels estimated by TIMER and binarized by the maximally selected ranked statistics algorithm. Depicted p-values are from log-rank tests. p: p-value.

