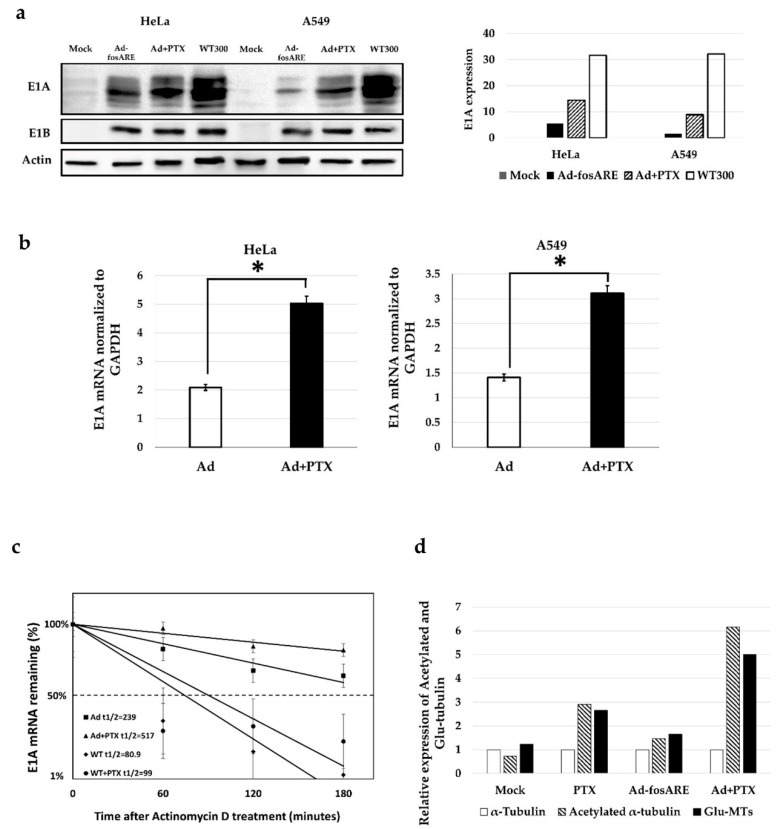
Figure 7.
Effects of paclitaxel on Ad-fosARE replication. (a) To check the viral protein synthesis, HeLa and A549 cells were treated in combination with Ad-fosARE (MOI 10) and PTX (4 nM). E1A and E1B55kd were estimated by western blot analysis. Densitometric data of E1A expression (left) (b) With the same dose of treatment E1A mRNA was detected by quantitative real-time RT-PCR using GAPDH mRNA as a normalized control. (c) E1A mRNA stabilization in Ad-fosARE infected cells. HeLa cells were infected with Ad-fosARE and WT300 (MOI-10 ifu/cell) and combination with PTX. Transcriptions were inhibited by actinomycin D 5 µl/mL for 60, 120, and 180 minutes. After the indicated periods, cells were harvested and extracted for total cellular RNA. mRNA levels are quantified by quantitative real-time RT-PCR experiments using GAPDH as a normalization control. Graphs depict the percentage of remaining E1A mRNA levels with GAPDH mRNA and compared with the standards of normalized mRNA species measured immediately after the addition of actinomycin D and which were set as 100%. The half-lives of the mRNAs (min) are indicated as t½. (d) To determine post-translationally modified tubulin, HeLa cells were treated with either Ad-fosARE, PTX or a combination of both. The expression of acetylated and Glu-MTs was quantified by densitometry and the values were normalized to non-infected conditions. Data are shown as the mean ± standard deviation of three independent experiments (* indicates p < 0.05).

